By Peter Kyveryga
Have you ever wondered why school students are routinely given a series of year-end tests when it may already be too late to help them master the material? Or why doctors insist on an annual medical check-up?
The answer is simple. Educators have developed a set of guidelines to help improve student performance and doctors have done the same when it comes to patient health. These two practices may seem unrelated to agriculture, but when it comes to adaptive nitrogen management, similar principles apply to collecting and utilizing feedback information in the form of corn nitrogen (N) status from late-season evaluations performed on farmers’ fields.
The idea of adaptive management, or farmer participatory learning, has recently been embraced by universities, private industry and government agencies. However, a wider adoption of adaptive management in agriculture has been hindered by the difficulty of defining decision options and predicting future outcomes based on the collected feedback information.
That’s why, using corn N status data collected between 2006-2013 from more than 3,500 farmer fields across Iowa, the Iowa Soybean Association’s On-Farm Network and Environmental Programs & Services teams have outlined a decision support system for adaptive nitrogen management.
A recent publication, “Adaptive Nitrogen Management: Post-Season Evaluations of Farmers Management Practices to Improve Nitrogen Use in Corn Production,” describes the three-step decision process to make future adjustments based on outcomes of nitrogen evaluations from individual fields and aggregated data. Click here to view the publication.
Steps include:
1. Base decisions only on individual fields. It is critical to understand the possible relationship between rainfall and corn N status. For example, fields that have a consistent excessive corn N status and receive above-average (> 14 inches) cumulative March through June rainfall (high risk of N loss) could be fertilized with lower nitrogen rates than in the previous years (Table 1). The use of multi-year observations (at least 2 years) of corn N status (corn stalk nitrate test guided by the aerial imagery) and after-the fact risk of N loss from individual farmer fields help for determining whether adjustments in future management are needed.
Table 1. Examples using the field-level post-season N status and risk of N loss to determine future N strategies.

2. Base decisions on aggregate data of many fields. Benchmarking farmer management, which includes rate, timing and forms, to aggregate data of farmer practices that resulted in the optimum corn N status across state, crop district or watershed. If a farmer’s nitrogen rates fall outside the optimal range (the gray boxes in Figure 1), it would suggest the need to reevaluate the current management. However, even if a N rate from an individual field falls inside the optimal range and results of replicated strip trials conducted by the same farmer confirm the optimal N range, the benchmarking process is still helpful to target the critical management practices across the state or watershed.
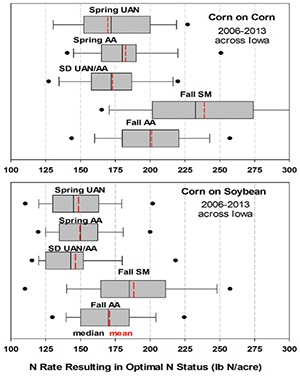
Figure 1. Distribution of N rates required to reach the optimal corn N status for different N management categories from 166 corn-after-corn and 465 corn-after-soybean fields evaluated across Iowa from 2006-2013. The boxes indicate 25th and 75th percentiles, the black vertical lines represent medians, the red vertical lines are averages, and whisker bars indicate 5th and 95th percentile. Predominant N forms and timing of application: AA Fall=fall-applied anhydrous ammonia; Swine Fall=fall-injected swine manure; SD UAN/AA=sidedress urea ammonium nitrate solution or anhydrous ammonia; Spring AA=spring-applied anhydrous ammonia; Spring UAN=spring-applied UAN.
3. Use aggregated data of corn N status, site-specific rainfall, and farmer management information across the state, crop district, and watershed to identify factors such as rainfall, previous crop, timing or N source that influenced N status in the previous year. For example, pooled data across the state in 2013 showed a higher percentage of deficient fields, especially with spring-applied urea and ammonium nitrate (UAN) for corn after soybean.

By using steps 2 and 3, that will allow researchers to benchmark farmer outcomes compared to peers across the state or watershed as well as to quantify the risk for a given field to be above or below optimal status for many possible combinations of management (timing, form, tillage, corn genetics), and soil and weather conditions. Even if farmers’ rates fall inside the defined optimal ranges, but the evaluated management practices require slightly higher N rates (e.g., fall-injected liquid swine manure in Figure 1), these outcomes should prompt farmers to use in-season diagnostic tools (e.g., soil testing or crop canopy sensing) to improve the efficiency of manure N use.
The bottom line is that to keep nitrogen management on track, it is essential to consider an annual “nitrogen checkup.” As shown in the new publication, aggregating feedback data across several years and geographies helps to define data-driven decision rules for making nitrogen management adjustments in the future.