By Romulo Lollato, Wheat and Forages Specialist lollato@ksu.edu; Dorivar Ruiz Diaz, Nutrient Management Specialist ruizdiaz@ksu.edu; Ray Asebedo, Precision Agriculture ara4747@ksu.edu
Long-term research has indicated that the optimum nitrogen (N) rate for winter wheat in Kansas shows a high year-to-year and site-to-site variability, ranging from zero to more than 120 pounds of N per acre depending on growing season conditions (Figure 1).
The high variability in optimum N rate is mostly led by weather conditions during the growing season (such as precipitation distribution), residual nitrate in the profile at sowing time, N mineralization rates (affected by temperature and precipitation regimes), and differences in soil characteristics and cropping systems/rotations.
Therefore, optimum N rate is highly unpredictable, and using the same flat rate of N fertilizer every year can result in either over- or under-fertilization.
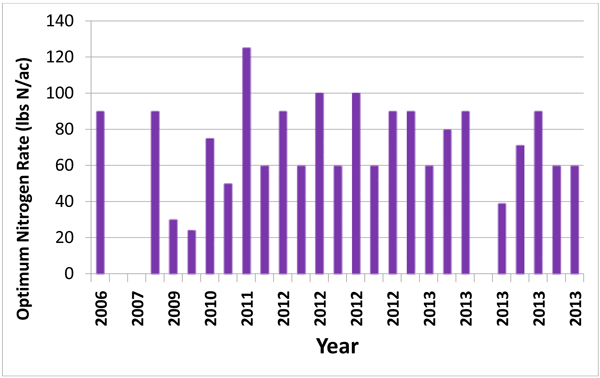
Figure 1. Optimum nitrogen rate for winter wheat in Kansas for several trials during the 2006-2013 period. Graph generated with information collected by Ray Asebedo, K-State Research and Extension.
In-season estimation of N needs
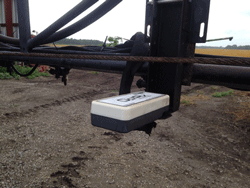
To help set the right N rate based on current growing season conditions, one tool growers can use is either an active optical sensor, such as the Topcon Cropspecs, Ag Leader OptRx, or Trimble GreenSeeker (Figure 2); or a multispectral imager such as the MicaSense RedEdge (Figure 3).
These can be very useful tools to help assess the N needs of a growing wheat crop between spring tillering (Feekes 3-4) and flag leaf emergence (Feekes 9). The investment necessary when adopting this technology ranges from $500 (handheld device used without mounting in any structure, Figure 3), to $10,000 for a MicaSense Rededge and a UAV (Figure 3), to more than $20,000 if the producer is interested in mounting multiple sensors (plus cables and processors) on a ground rig and performing on-the-go variable rate N application (Figure 2).
 |
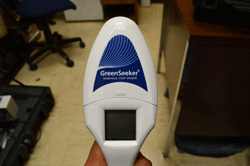 |
Figure 2. Topcon Cropspecs mounted to John Deere 4052r, Ag Leader OptRx sensor mounted on boom (left), Trimble GreenSeeker handheld sensor (right).
How do optical sensors work?
Optical sensors are generally categorized into two categories: active and passive. While it’s not absolutely necessary to understand the science behind optical sensors in order to be able to use them in the field, it is interesting and helpful.
Both types of optical sensors detect light reflectance; however, the defining factor is their light source. Active optical sensors have their own internal light source and do not require the sun to illuminate the crop. Therefore, they can operate under any kind of sky condition. Passive optical sensors such as cameras or multispectral imagers rely on sunlight to illuminate the crop. Therefore, they are more sensitive to changing sky conditions and the time of day they are used. The most common wavelengths of light used by optical sensors is near infra-red (NIR) and red. The reflectance of these wavelengths is often used in the normalized difference vegetation index (NDVI) to assess crop health:
NDVI = NIR - red
NIR + red
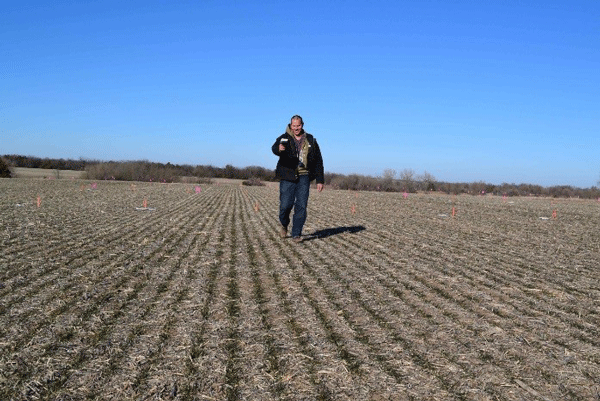
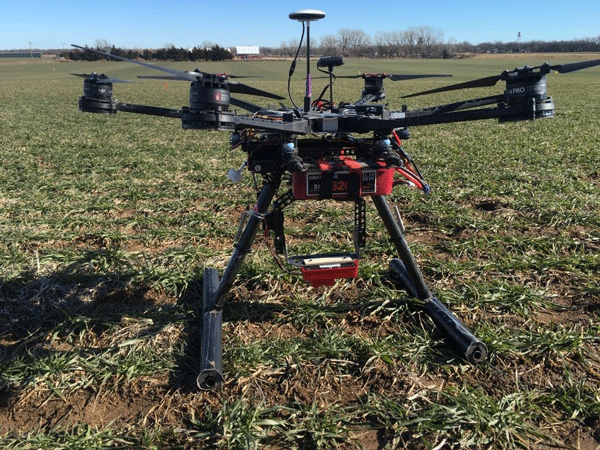
Figure 3. Using handheld Holland Scientific Rapidscan prior to topdressing wheat (top, photo by Dave Mengel, K-State Research and Extension) and MicaSense mounted to DJI S800 prior application.
Light in the red band is directly used by plants for photosynthesis; thus, lower reflectance rates on that band means there is more absorption — and more healthy chlorophyll is present in the wheat canopy. NIR light strongly interacts with spongy mesophyll cells in the plant, therefore more NIR light is reflected back to the optical sensor with increasing plant biomass. So in a sense, a red NDVI gives the farmer information on how big and efficient their wheat crop is in working to produce yield.
Lush canopies will reflect less on the red and more on the NIR, resulting in high NDVI values and lower N requirements. Likewise, thin canopies will reflect more in the red and less on the NIR, resulting in low NDVI values and greater N requirements (Fig. 4).
Optical sensors provide a reading for the wheat crop’s NDVI, but do not perform the N recommendation. The NDVI measurement is then entered as input in algorithms generated based on research, which provide the actual N recommendation.
Without a good algorithm, the sensors simply provide a number that quantifies wheat growth. Recent studies focused on evaluating the performance of ground- and UAV-mounted optical sensors in managing N on winter wheat using NDVI-based N recommendations developed at K-State.
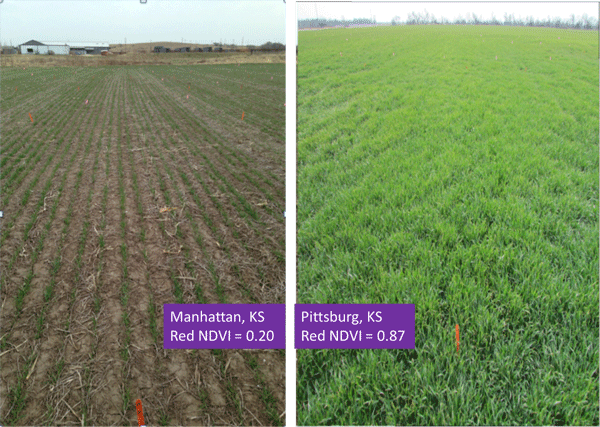
Figure 4. Difference in NDVI as affected by canopy cover at a similar wheat growth stage (Feekes 4).
Does the technology pay off?
We conducted a research project at eight locations around Kansas in 2014-15 and five locations in 2015-16, comparing the value of using soil testing or crop sensors in making N recommendations.
Treatments in this project included increasing N rates of 0, 25, 50, 75, 100, and 125 lbs N/acre; an N rate based on K-State’s standard N recommendation formula with soil test data; and N rates based on K-State’s new N recommendation formula using optical sensor data from either a single pass at Feekes 4 or two passes at Feekes 4 and 7. Performance of these treatments was compared using grain yield and agronomic efficiency.
KSU Research Results
In most cases in these tests, K-State’s sensor-based N fertilization recommendations were lower than N recommendations using K-State’s standard N rate recommendation formula with soil test data. More importantly, the lower N rate recommendations from the sensor-based technology did not limit wheat yields.
However, the yield response will depend on environmental conditions at time of N application and at time of grain yield formation.

For instance, if N rates are decreased and followed by near-perfect weather conditions for grain fill, K-State’s sensor-based N management might leave some yield on the table compared to what would have occurred with higher N rates.
For normal growing conditions experienced in the great majority of the studied cases and most years in Kansas, N rates can be based on optical sensor readings at Feekes 4, or Feekes 4 and 7, using K-State’s algorithms — and N rates can be decreased if the sensor readings call for less N than the recommendation from the standard K-State N recommendation formula — without limiting grain yields.
More detailed information about the results obtained in this study is provided in the following paragraphs.
The 2014-15 growing season was extremely dry until early May, with very limited organic matter mineralization up to then. Under these conditions, where yield goal recommendations were made in the absence of soil test information, the normal recommendation averaged 78 pounds N per acre across the eight sites.
Adding the results from fall or winter profile soil tests into the standard K-State N recommendation equation reduced the average N recommendation across these sites by 24 pounds per acre to 54 pounds per acre (the soil test information actually increased the N recommendation at one location).
Using a crop sensor-based N management system at Feekes 4, shortly after greenup, further reduced the N recommendations by an additional 10 pounds per acre to an average of 44 pounds N per acre.
Using the sensor twice, shortly after greenup and at second joint, N rates were reduced another 17 pounds per acre to a total of 27 pounds of total spring N. How did the yields turn out? The average yield across the sites was 52 bushels per acre, and ranged from 27 to 73 bu/acre.
There was virtually no response to N rate at most sites, with only one of the 8 sites showing a clear statistically significant response to N. In other words, reducing N rates by using active sensors and K-State’s algorithms did not result in yield loss by the producer, saving input costs and increasing overall profitability.
During the 2015-16 season, spring precipitation started earlier (approximately mid-April for most of the state), and grain filling conditions were near optimal (cool and moist).
Under these high-yielding conditions, a greater response to N rates was observed. For instance, the Clifton location responded well to N applications, with grain yield increase continuing up to 125 lb N/acre (although not statistically significant beyond 75 lb N/acre).
The K-State N recommendation generated from using a single optical sensor reading at Feekes 4 was lower than the N recommendation from the standard K-State recommendation formula using soil test data. Grain yields were statistically equal at the two different N rates, meaning the N rate from the optical sensor readings had greater agronomic efficiency.
The best performance in regards to grain yield and agronomic efficiency occurred with the K-State N recommendation generated by optical sensor when used at both Feekes 4 and Feekes 7, and with two topdress applications. This two-pass approach using optical sensor technology reduced total N rates by about half while maintaining statistically equal grain yield to the soil-test-based K-State N recommendation.
Wheat protein content
Currently, K-State also has algorithms developed to fertilize for high-yield and high-protein wheat using active sensors. In cases in which producers are compensated for high-protein wheat, such as when marketing directly to specific mills that pay a premium for protein content, producers can consider this option.
However, fertilizing for high-protein will not be profitable if producers do not get a premium for it. Still, it is important to consider the overall quality of wheat production in Kansas as a whole, maintaining minimum protein levels of the market class. While decreasing N rates might be tempting, especially in years when the commodity prices are low, the market might practice a discount for low protein hard red winter wheat, also affecting producer’s profitability.
On a larger scale, the market might avoid buying wheat from regions known for low protein content; thus, it is not recommended to decrease N rates to levels which might result in protein contents below approximately 12.5%.
Preliminary conclusions
All results shown above are in line with years of previous research conducted in both Kansas and neighboring states, such as Oklahoma, which indicates that in most cases the use of optical sensors to manage wheat N rate results in reduced N application without a consequent reduction in wheat yields.
Some years the sensor-based N management will leave yield on the table by reducing N rates; and in a few years it will overestimate N needs. However, our results allow us to conclude that in most years, sensor-based N management reduces N rates and maintains wheat yield in Kansas.