
No-Till Farmer
Get full access NOW to the most comprehensive, powerful and easy-to-use online resource for no-tillage practices. Just one good idea will pay for your subscription hundreds of times over.
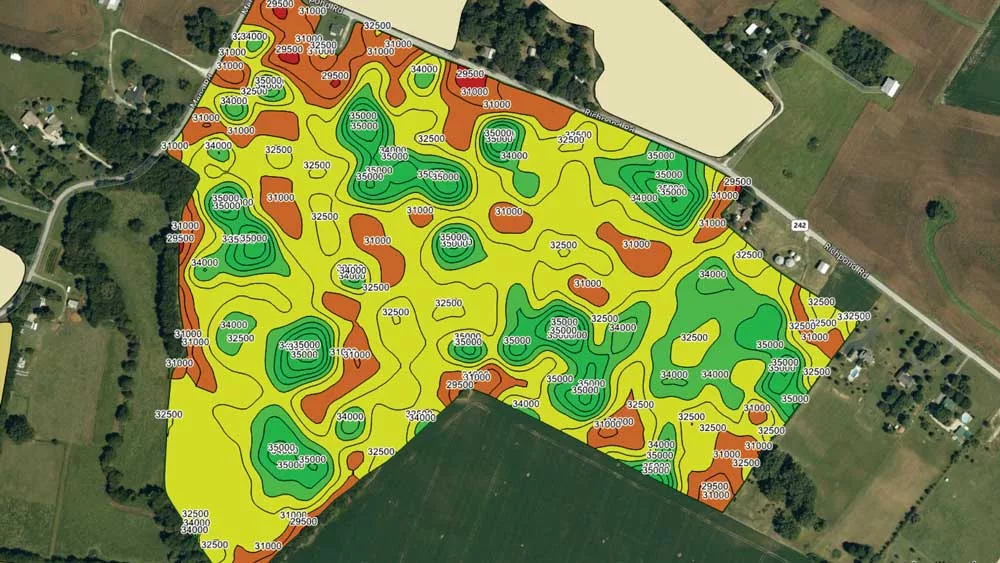
PUSHING POPULATIONS. This variable-rate seeding map of Mark Chapman’s field shows how he adjusts the seeding rate based on each zone’s yield potential compared to the field’s average yield history (see Target Seeding Rates for more details).
For decades Mark Chapman was aware of the differences within his fields.
“We’re known that we had high-yielding regions and lower-yielding regions,” says the Bowling Green, Ky., no-tiller. “Lots of times we knew why, but we weren’t able to do something about it.”
But that all changed once he was able to bring GPS onto the farm. With the ability to collect site-specific data, he can also take site-specific actions to address those issues using variable-rate technology (VRT).
At the 2021 National No-Tillage Conference, Chapman shared his strategy for variable-rating fertilizer and seed, and his advice to other no-tillers on successfully implementing the technology on their own operations.
The first step to using VRT, Chapman says, is to ask yourself why you want to use it…

Get full access NOW to the most comprehensive, powerful and easy-to-use online resource for no-tillage practices. Just one good idea will pay for your subscription hundreds of times over.
Download these helpful knowledge building tools

We have engineered and developed the most advanced concave system that threshes all crops, eliminates rotor loss, improves grain quality, gives you a cleaner sample – all with one set of XPR concaves.
At Titan International, our product portfolio reflects our commitment to innovation and high-quality products. Titan International offers a full line of solution-focused wheel, tire, and undercarriage products for a wide variety of off-the-road equipment in agriculture, construction, forestry, mining, power sports, high-speed trailers, and outdoor power equipment segments. As one of the largest North American manufacturers, with a network of dealers all over the world, Titan is an industry leader that original equipment manufacturers and operators can count on for durable products and quality service.

Provide expert analysis and decision support to increase productivity and profitability.