Since 2012, acres in the U.S. have been shifting out of corn and into soybeans, likely as a result of higher returns for soybeans than for corn. The longer termed trends since 1996 have been increases in corn and soybean acres and decreases in wheat acres. Within Illinois, acreage shifts have been predominately between corn and soybeans.
Corn, Soybeans and Wheat Acres in the U.S.
Acre shifts have occurred in the United States after the passage of the 1996 Farm Bill (see Figure 1). The 1996 Farm Bill, informally known as the Freedom to Farm Bill, eliminated set-asides, the last vestiges of supply control implemented for program crops in farm bills (farmdoc daily). Since 1996, market forces and relative returns between crops have been more important in determining planting decisions.
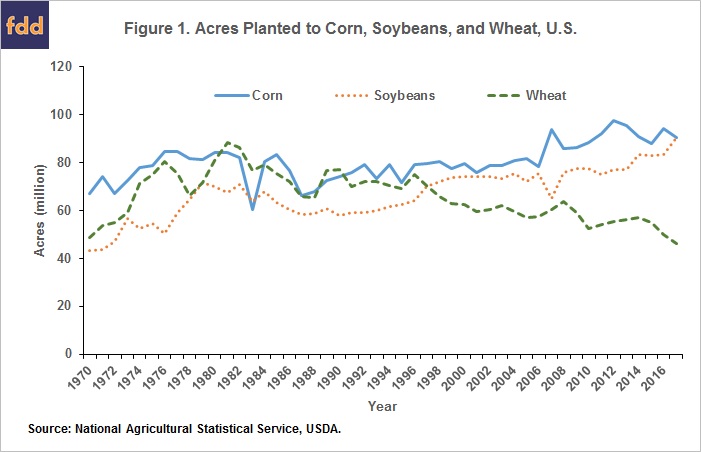
From 1996-2012, the major trends have been increased acres planted to corn and soybeans and decreased acres planted to wheat (see Figure 1). Corn acres increased from 80 million acres in 1996 to 97 million in 2012. Soybean acres increased from 64 million in 1996 to 77 million in 2012. Wheat acres decreased from 75 million acres in 1996 to 55 million acres in 2012. There were notable blips in these trends. Most notably, corn planting increased dramatically from 78 million acres in 2006 to 94 million in 2007, before falling back to 86 million acres in 2008. At the same, time soybean plantings decreased from 76 million acres in 2006 to 65 million in 2007, before increasing to 78 million in 2009. Despite this and other blips, the clear trend has been increased corn and soybean acres and decreased wheat acres.
Since 2012, the trends have changed somewhat in that corn acreage has declined. Corn acres fell from 97 million acres in 2012 to 88 million acres in 2015. Corn acres then increased to 94 planted acres in 2016, before falling to 90 million in 2017. In 2017, 7 million less acres of corn were planted than in 2012.
Since 2012, soybean acres have continued their increase. Soybean acres reached an all-time high of 90 million acres in 2017. Wheat acres continued to decline. Wheat acres fell from 55 million acres in 2012 to 46 million in 2017.
Much of the acreage changes can be changed by relative profitability. Figure 2 shows the value of production less total costs (VPTC), as reported by the Economic Research Service, U.S. Department of Agriculture. These are per acre values for corn, soybeans, and wheat averaged across the U.S. Note that VPTC includes only crop revenue and does not include crop insurance proceeds or Commodity title payments. As a result, values in Figure 2 understate returns, but should be highly correlated with returns.
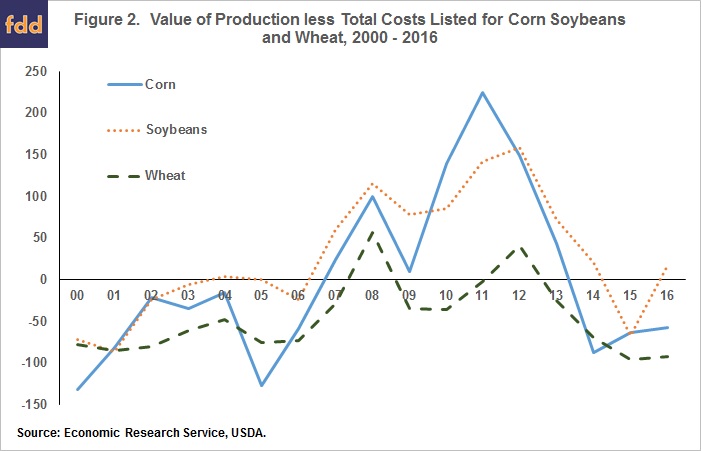
From 2000-2012, VPTC for corn and soybeans usually exceeded VPTC for wheat. During this period, corn and soybean acres grew at the expense of wheat acres. Since 2012, soybean VPTC has exceeded corn VPTC in all years except 2015. Since 2012, soybean acres have grown while the corn and wheat acres have declined. At the very least, relative profitability is suggestive of acreage changes.
Corn, Soybeans and Wheat Acres in Illinois
Since 1996, acreage changes in Illinois have been primarily shifting in acres between corn and soybean. Between 1996-2017, the sum of acres planted to corn, soybeans, and wheat have varied within a tight band from 22.0 million acres to 22.7 million acres (see Figure 3). Over the period, planted acres in wheat have been a small and declining, decreasing from 1.7 million planted acres in 1996 to .5 million acres in 2017. Overall though, acreage switches have been between corn and soybeans in Illinois.
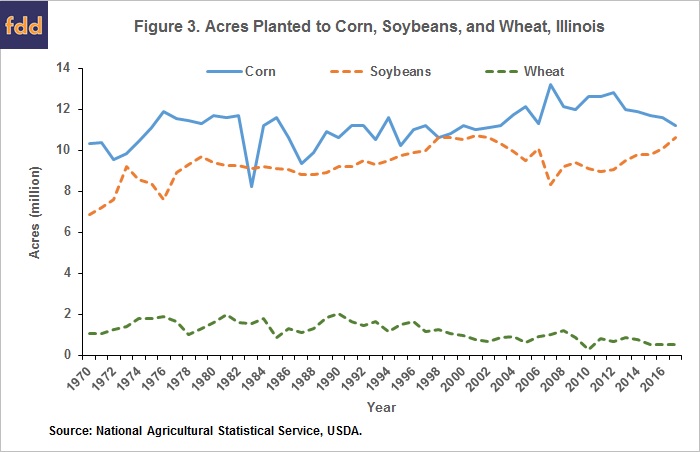
In 1998, corn and soybean acres were each at 10.6 million acres. With some yearly variations, corn acres then increased and soybean acres generally decreased from 1998-2012. In 2012, 12.8 million acres of corn were planted and 9.0 million acres of soybeans were planted. Corn plantings increased by 2.2 million acres. Soybean plantings decreased by 1.6 million acres.
Since 2012, corn acres have decreased and soybean acres have increased. Corn acres declined from 12.8 million acres in 2012 to 11.2 million acres in 2016. Soybean acres increased from 9.0 million acres to 11.2 million acres in 2016.
These shifts in acres have mirrored changes in the relative profitability of corn and soybeans. The change in relative profitability has been examined here on farmdoc daily. Values summarized from Illinois Farm Business Farm Management (FBFM) indicate that corn was more profitable in most years from 2000-2012 (see Figure 4). From 2014 onwards, soybeans have been more profitable than corn.