By Randy L. Anderson, USDA-ARS, Brookings, S.D.
Many producers in the Great Plains believe that cover crop growth can be increased by planting mixtures of species. This gain in biomass occurs because mixtures can use resources more effectively.
For example, a plant canopy comprised of several layers of leaves is more effective in capturing sunlight than if all leaves occupy one layer. However, research has shown that some mixtures of cover crops can yield considerably less than sole crops. One study found that biomass of a 4-species mix that included oat was 25-40% lower than oat grown alone in 3 years out of 4.
We were intrigued as to why production of some mixes isn’t as productive as expected. We recently conducted a research trial with cover crop mixes that may provide insight for planning productive mixtures.
Our study focused on the fall growth interval, and was conducted near Brookings, S.D., where yearly precipitation averages 23 inches. Four cover crop treatments were established in early August of 2014 and 2015, following spring wheat harvest:
- oat alone
- oat + dry pea + oilseed radish
- 3 species in treatment 2, plus lentil, flax, and common vetch; and,
- 6 species in treatment 3, plus buckwheat, cowpea and hairy vetch
These species were chosen because they are widely used in eastern South Dakota. Seeding rates followed NRCS recommendations and were adjusted for mixtures — i.e., planting a 1/6 rate for each species in a 6-species mixture. Species were planted at 1.5-inch depth and in rows spaced 7.5 inches apart.
We recorded density of each species 4 weeks after planting, and biomass of treatments and individual species 9 weeks after planting.
As expected, the oat-dry pea-oilseed radish (O-P-R) mixture was more productive than oat alone, yielding 280 g/m2 or 27% more biomass than oat (Table 1). However, the 6- and 9-species mixtures were less productive than the O-P-R mix: biomass was only 203 g/m2 for the 6-species mixture and 220 g/m2 for the 9-species mixture (data not shown), approximately 24% less than O-P-R.
| Species | Oat | O-P-R | 6 Species |
|
-------------------- |
g/m2 |
-------------------- |
|
| Oat | 220 | 120 | 97 |
| Dry Pea | -- | 48 | 38 |
| Oilseed Radish | -- | 112 | 37 |
| Flax | -- | -- | 16 |
| Lentil | -- | -- | 10 |
| Commom Vetch | -- | -- | 5 |
| Total Biomass | 220 | 280 | 203 |
Table 1. Biomass (dry weight) of individual cover crops in various mixtures, averaged across two years, 2014 and 2015. The abbreviation, O-P-R, refers to oat, dry pea and oilseed radish.
To understand this trend, we examined oat, dry pea and oilseed radish growth among mixtures. These species produced 182 g/m2 in the 6-species mixture, or 65% of biomass in the 3-species mixture, 280 g/m2 (Table 1). Less production of these species in the 6-species mixture was expected, as seeding rate for these species was reduced 50%.
We assumed that the other species added to the mixture would compensate for less production of oat, pea, and radish, as community density of seedlings (330 plants/m2) was similar among treatments. But adding flax, lentil, and common vetch to O-P-R did not compensate for less biomass of oat, dry pea, and oilseed radish. These species produced only 31 g/m2. Apparently, these species are not as productive as oat, pea, and radish.
But, we noticed a second trend when we compared individual species production. Oat and dry pea biomass in the 6-species mixture was 80% of corresponding biomasses in the 3-species mixture (Table 1), even though their seedling density was half of the density in the 3-species mix.
In contrast, biomass of oilseed radish in the 6-species mixture was only 33% of its biomass in the 3-species mixture (37 compared with 112 g/m2). Oilseed radish didn’t compensate for the lower seeding rate like oat and dry pea. If oilseed radish in the 6-species mix had produced 80% of its biomass in the 3-species mix (90 g/m2 instead of 37 g/m2), the 6-species mix would have produced similar biomass as the 3-species mixture.
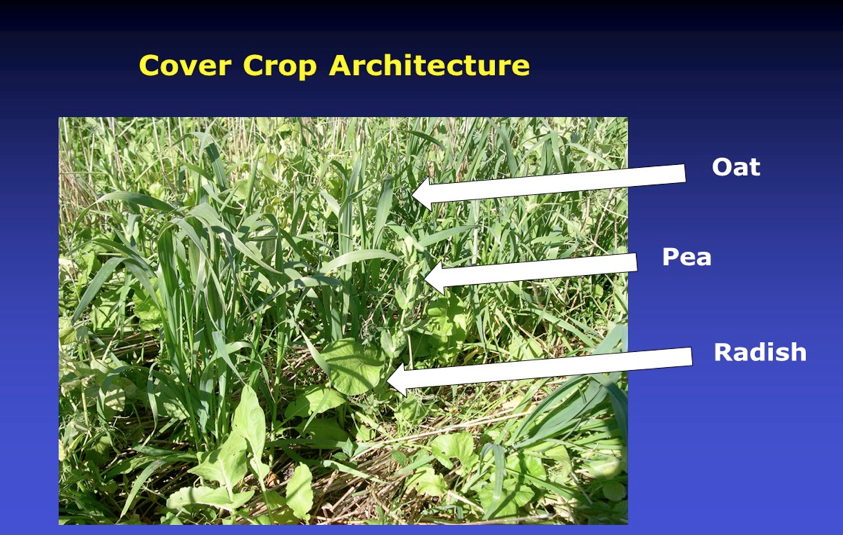
Figure 1. Growth zones in the canopy of the mixture: oat, dry pea, and oilseed radish, 9 weeks after planting in early August.
We speculate that this difference with oilseed radish production is related to canopy architecture. Biomass may be higher in the 3-species mix because each species occupied a different zone in the canopy (Figure 1). At biomass sampling, most of oat leaves occupied a layer 15-20 inches in height (high zone), dry pea leaves grew in the mid-zone (10-15 inches in height), and oilseed radish leaves grew in the low zone (less than 10 inches high). This differentiation into zones was noticeable 4 weeks after emergence.
With the 6-species mix, dry pea, lentil, flax, and common vetch occupied the mid-zone. We believe these 4 species, along with oat, suppressed growth of oilseed radish, whose leaves remain close to the soil surface, by intercepting most of the sunlight.
An even greater reduction in oilseed radish biomass occurred with the 9-species mixture, where 8 of the 9 species grew in the high and mid-zones (oilseed radish biomass was 7 g/m2, only 3% of the 9-species biomass). Oat, pea, and oilseed radish responded differently to competition among species.
Growing one species in each of the three zones may have minimized interspecies competition in the 3-species mixture. Other cover crop species may respond differently to canopy architecture, but this approach was favorable for oat, dry pea, and oilseed radish productivity.
If more species are preferred, arranging species to occupy these three zones equally may minimize interspecies competition and improve productivity (species examples by zones are shown in Figure 2). Considering canopy architecture may be especially helpful when low-growing species such as oilseed radish or turnip are included in the mixture.
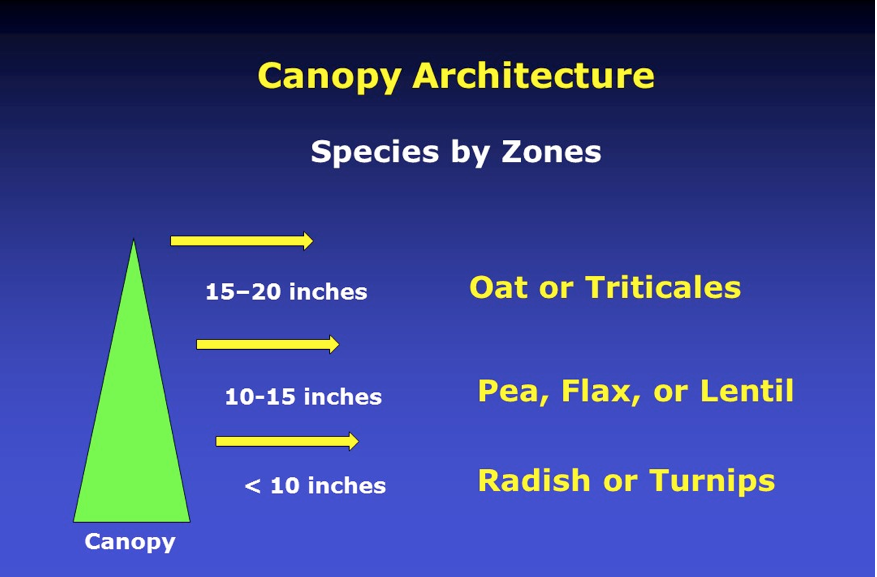
Figure 2. Examples of species that would occupy specific zones of a fall-growth canopy of cover crops.
Species Diversity and Biomass
Producers often choose multi-species mixtures to enhance diversity of the soil microbial community. This is a viable goal, but as we considered our data in Table 1, we questioned whether the 6-species mixture would be more favorable for microbial diversity.
Our concern is that biomass of two species — flax and vetch — comprised less than 7% of the mixture’s biomass. The root growth of this species likely was also minor, therefore, their impact on the microbial community would be small.
This raises the question as to whether more species diversity compensates for less biomass. In our trial, the 6- and 9-species mixtures produced 20-25% less biomass than the 3-species mixture. Even with fewer species, the 3-species mixture would favorably affect the microbial community because three functional groups (legume, oilseed, and grass) comprised the mixture.
If a multi-species mixture, such as a 12-species mix, was as productive as a 3-species mix — and each species comprised 8-9% of the community biomass — then the mixture would increase microbial diversity more that 3-species mixtures.
But if biomass of the 12-species mix was 25% less, and 3 or 4 species comprised 85% or more of the community biomass, it is questionable whether microbial diversity would be enhanced more than with a 3-species mix that produces more root growth.
Canopy Architecture in Planning
Considering canopy architecture may help producers in planning cover crop mixes. In Figure 3, we suggest a series of steps for planning mixtures. The first step is to identify the goals for the cover crop interval, such as nitrogen (N) scavenging, forage for livestock, residue production, and/or weed suppression.
Then, choice of cover crops species could be based on C:N ratio management, diversity related to sequence of cash crops before and after the cover crop interval, and canopy architecture. Considering canopy architecture would be especially helpful if a producer was seeking multiple goals with cover crops, planning mixtures to include species such as radish or turnip, and striving for maximum biomass production.
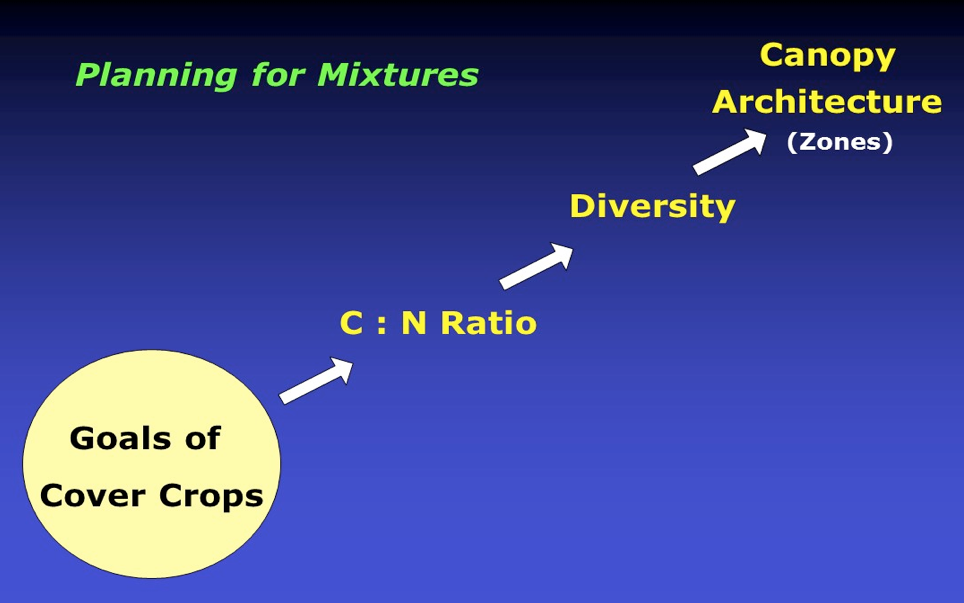
Figure 3. Integrating canopy architecture with planning cover crop mixtures.