By Robert Tigner, Charles Shapiro and Richard Ferguson
Current economic conditions are a challenge for crop producers to earn profits from corn, soybean, winter wheat, and milo production. Following is a discussion around how to make nutrient decisions this year.
Robert Tigner is an Extension educator focusing on agricultural economic issues. Charles Shapiro and Richard Ferguson are soil fertility specialists at the University of Nebraska Extension.
Finding Savings in Variable Costs
Robert Tigner: Fixed costs are already built into this year’s cost of production and can’t be easily managed in the short run, but variable costs such as seed, fertilizer, fungicide, and herbicide can be managed to minimize potential losses this year. When deciding on which inputs to use, start with the basic decision principle for managing variable costs.
The basic principle is to find the quantity of an input where the cost for one more unit of the input equals the value of yield gained from the input. This is called Marginal Cost = Marginal Revenue (MC=MR).
Here’s how it works: When 10 lb of nitrogen is applied at a cost of $5, the value of the yield increase must be at least $5. At today’s price of corn ($3.53, October 2016 new crop) 10 lb of nitrogen must produce at least 1.4 bushels more corn. If that 10 lb of nitrogen yields more than $5 income, additional nitrogen is added until the MC=MR point is reached. That point is always less than maximum yield.
Charles Shapiro: Is this an appropriate analysis when we don’t have unlimited money to invest?
Robert Tigner:This example assumes that enough resources are available for all acres to reach MR=MC; however, that is not the case for most operations. The manager has to decide how to allocate inputs to maximize profit.
The “Equal Marginal Principle” is how managers decide where to allocate limited inputs.
Let’s use nitrogen as an example. If a manager has enough money for 50 lb of nitrogen and two crops, a decision on how to allocate the nitrogen must be made.
To maximize profit the nitrogen is allocated to maximize gross income from the two crops. If only 25 lb can be applied at a time, the first 25 lb would go to the crop producing the most gross income from that application. The next 25 lb would go to the crop that would do the same. This may be the same crop, or it may a different crop.
The same principle can be used for irrigation water. Simply using all of an input for corn but shorting another crop, such as soybean, sugar beets or alfalfa, may reduce the total gross income of an operation.
Charles Shapiro: This sounds like we need to know the “point of diminishing returns” where the inputs become less and less effective.
The problem in nutrient management is that we know this relationship exists, but we can’t give a very accurate production curve for every situation. Differences in soil and weather influence yields in ways we can’t predict at the time input decisions are made.
That is why field research is conducted and other factors are considered when making recommendations. The previous five years of yields give a reasonable estimate of yield potential which can be used as a base for nitrogen recommendations.
Robert Tigner:Charles, you put this agricultural economist in a bad position if you can’t give me a production function to analyze.
Richard Ferguson: The Nebraska Extension Soils Group has approached this problem in several ways since each nutrient has different characteristics in the soil. In this discussion we are focusing on nitrogen and phosphorus management in corn. For these nutrients we use soil test information as a basis for making a recommendation.
Nitrogen
Our research base for corn nitrogen recommendations is much larger and covers a greater geographic area than for other Nebraska crops; hence, our recommended procedure takes several factors into account.
The Nebraska Extension resource,Fertilizer Suggestions for Corn (EC 117), provides helpful detail to this discussion.
For corn nitrogen needs, Nebraska Extension uses a mass balance approach. It balances the nitrogen requirement for a certain yield level with sources or credits available, making up the difference in the nitrogen fertilizer recommendation.
The least-cost nitrogen recommendation uses:
• All the credits;
• Avoids N losses
• Understands multiple applications are more efficient than front-loading applications with high rates; and
• Examines the cost of split application vs using an inhibitor and tries to predict which nitrogen losses to guard against.
EC 117 also suggests how to adjust the recommended nitrogen rate for varying price ratios of corn to nitrogen.
For example, based on a corn price of $3.56/bu and a nitrogen price of $0.50/lb, the price ratio is 7.1 with a recommendation adjustment factor of 0.94. When the ratio is less than 8 (nitrogen is relatively more expensive than normal compared to corn), the profitable nitrogen rate is less than normal.
In this case, if the recommendation was for 140 lb/ac of nitrogen under normal conditions, it would be adjusted to 132 lb/ac. In this case, there’s not a lot of difference.
Effect of Nitrogen Losses
Charles Shapiro: Potential losses are not specifically included in the EC 117 recommendations. The recommendations are derived from field research so they include an average amount of nitrogen loss.
Nitrogen losses reduce efficiency and cost money. When they happen, more nitrogen is needed. Each season attention needs to focus on whether there may have been nitrogen loss. Two common nitrogen loss situations are:
1) Heavy rains after application but before crop use is the biggest risk factor.
2) No-till nitrogen surface application to moist soils followed by minor winds without rain is probably the second biggest risk factor. (Drying conditions may slow loss.)
In most cases it’s likely too much nitrogen is applied, given surveys and nitrogen use reports indicate that available nitrogen credits are not always taken into account. The recommendation is to put on what the EC recommends, and remediate if need be.
Phosphorus
Robert Tigner: The way soil scientists have constructed their economic adjustment is not exactly an MC=MR analysis, but it is similar since it adjusts a recommended nitrogen rate based on the relative price of both the income from corn and the cost of nitrogen fertilizer.
With phosphorus, there is more opportunity to adjust application rates based on economic conditions because soils contain a reservoir of phosphorus, which is not easily lost from soil. Many producers have built their fields to high phosphorus levels.
Research in Nebraska consistently shows that there is little probability of getting an economic return from phosphorus fertilization when soil tests are in the high level. Going back to the marginal cost and return described above, when the return is close to zero, the input should not be used.
Charles Shapiro: Because most phosphorus applied in excess of crop removal is likely to stay in the root zone as Robert mentioned, phosphorus research needs to be multi-year to determine not only the economic return this year, but how to fertilize in the future to be most profitable. At this time, phosphorus recommendations are not based on the mass balance approach described for nitrogen.
A phosphorus recommendation is based on a “critical level” approach where the soil needs to have a minimum soil test level over which response to phosphorus is unlikely. Phosphorus can be applied when the soil test level is greater than the critical level, or more phosphorus can be applied than needed in one year. However, the probability of getting a yield increase to pay for the phosphorus is much lower than if the soil is at or below the critical level.
Robert Tigner: From an economic analysis point of view, applying more phosphorus than needed is not profitable; however, if the phosphorus source is much less expensive than normal, it may make sense to “invest” in phosphorus. This is what is done when manure is applied, filling several years of phosphorus need at one time. It may require discipline to not apply more phosphorus for several years.
Charles and Richard, in EC 117 there is one recommended rate for phosphorus based on soil tests, with a slight adjustment for application placement, less when banded. How can we make an economic analysis without any response information?
Richard Ferguson: Robert, you are correct, we have not included any economic data for two reasons. The first is when the recommendations were developed, the critical level was chosen to assume that the application of phosphorus at the rate recommended would be profitable. We have not collected enough recent information to change that procedure. A group of UNL soil scientists are actually working on this issue and may change the recommendations in the future.
Charles Shapiro: To illustrate these points, consider how we determine our phosphorus recommendations. The way we determine when we expect a response to applied phosphorus is based on putting rates of phosphorus out on many fields with varying soil test levels.
We use the data to determine at what soil test level adding phosphorus does not increase yields. When the yield increases stop, we know the “critical level.” In most cases we are not comparing a soil test level of 15 and 45 in the same field. It is possible that the fields with soil test levels at 45 are more productive than 15, but when phosphorus is applied, there is no yield increase.
While the ideal would be to have an equation of crop response to phosphorus at many soil test phosphorus levels, this is difficult and time consuming research.
Richard Ferguson: Another way to determine the effect of phosphorus on corn is by applying the same rates over many years and monitoring both the yields and change in soil test levels.
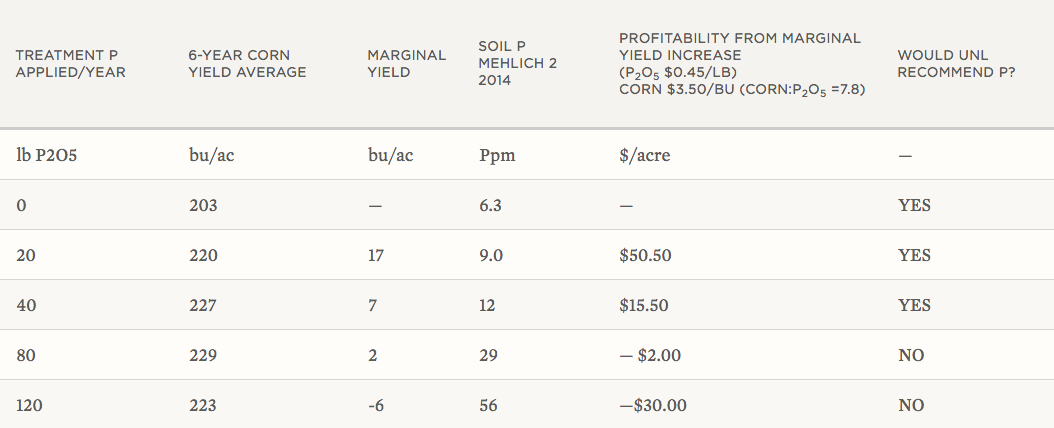
This is shown in Table 1 from an on-going study under irrigated continuous corn at UNL’s South Central Ag Lab near Clay Center. The results show that using the UNL recommended fertilizer rates is profitable.
Applying 40 lb/ac P2O5 annually is not enough to maintain or attain the critical level (15 ppm Bray-1.) (This Bray-1 level is slightly different than the Mehlich II extractant reported below. Multiply Mehlich II by 0.9 to get the Bray-1 equivalent.)
When the study started, the field had a soil test level of 7 ppm Bray-1. Therefore the 40 lb rate is slowly building the soil and is the most profitable at $66 return over the non-fertilized control.
Robert Tigner: When money is scarce and you can get higher returns from another input, you can skip a phosphorus deposit in your soil nutrient “bank” for a year. Table 1 shows the net return to phosphorous fertilization using economic marginal analysis. As phosphorus prices change, the analysis may change. This type of marginal analysis can be done for any crop input where yield data is available.
Phosphorus Recommendations
Charles Shapiro: We have discussed a lot of fine points about phosphorus, but here are our cost-cutting suggestions:
• Don’t build soil above the critical level when phosphorus is expensive or expected to be less expensive in the future.
• Use starter fertilizer placement for best effect at low application rates.
• Use soil tests, preferably grid samples and variable rate. Follow UNL recommendations. For extremely tight cash situations, don’t apply where soils are over 15 ppm Bray-1 equivalent.
Lime
Richard Ferguson:Lime is another input that could be postponed when costs are a major concern. There is no input/output equation for lime so a specific MC=MR calculation can’t be made.
Ideally, under a periodic soil testing program, soil pH should never reach yield limiting levels before liming. Soil pH should be above 5.6 for soybeans and 5.3 for corn. There is some leeway here since many Nebraska soils have high pH subsoils.
Lime can be applied annually, but the cost of spreading usually makes larger applications more economic. Soil tests give you the rate to get to neutrality, which is not necessary. You can apply less, but would need to apply more often.
Summary
In summary, use the UNL Corn N Calculator to determine the right nitrogen rate, then use the economic adjustment to fine-tune it.
For phosphorus and lime determine if your levels are adequate for this year. Remember that if phosphorus and lime applications are skipped this year, you’ll want to re-examine need when more money is available.
Table 1. Effect of phosphorus application rates on yield, yield increases, profitability, soil test P level, and return on investment. Clay Center, Neb., 2009-14.