The Kentucky Small Grains Growers Association looked at nine products and their impact on wheat yields. The following is a progress report from the association.
The primary goal of this research is to provide new product information to wheat growers. New product releases, which occur every year, are often accompanied by weak performance evaluation information — often testimonials based on invalid comparisons. Chemical soil compaction treatments, liquid carbon and foliar nutrition products are already in the marketplace, and a new group of “biological/microbiological” products is now emerging.
Are any of these new materials going to be the “next big thing” in wheat production? The objective was to evaluate nine products intended to raise Kentucky wheat yield. Six products were specified by the Kentucky Small Grain Growers Association.
The trial was established at the Princeton Research and Education Center on a Crider silt loam under a corn, wheat, double-crop soybean rotation. Initial soil fertility was good (pH 6.6; potassium (K) 349; zinc 3), but soil test phosphorus (P) (54) triggered a recommendation of 30 pounds P2O5 per acre. There were six replications of 10 treatments (Table 1), in one of three classes: a) seed; b) soil; and c) foliar products.
Pembroke 2014 seed was treated on Oct. 7, 2014, and no-till planted on Oct. 8 into corn residues. Treatments 2 and 3, DAP (diammonium phosphate, 18-46-0), and DAP treated with Avail, were applied after planting. Stand counts were done on Oct. 21 on 10-foot center rows. Foliar treatments (Coron and BioForge) were applied during late vegetative growth to maximize foliar uptake. Flag leaf tissue were taken late in wheat flowering to determine treatment impact on plant nutrition. Wheat was harvested on June 13.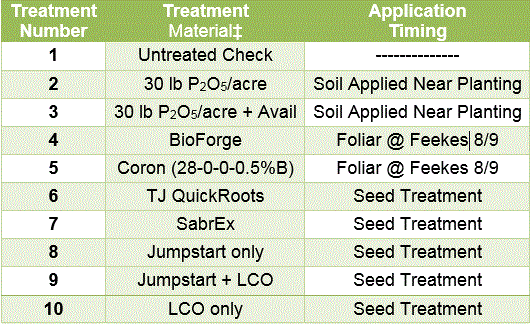 Table 1. Treatment materials and application timing in the wheat PEP-NBT study.
Plant stands ranged from about 22 to 25 plants per square foot, with an average of 23.5 plants per square foot, and were not affected by treatments. No seed treatment resulted in a stand greater than the untreated check.
Evaluating wheat’s macronutrient nutrition, leaf nitrogen (N) was a bit greater with phosphate, phosphate + Avail, Coron, and the TJ QuickRoots, SabrEx and Jumpstart + LCO seed treatments (Table 2). Leaf N tended to be lower in the untreated check, with BioForge, and with only Jumpstart or only LCO seed treatments. Leaf phosphorus (P) was greatest with phosphate or phosphate + Avail application, but was lowest in the untreated check, with BioForge, Coron and the SabrEx, Jumpstart + LCO and LCO only seed treatments (Table 2). Avail addition did not improve leaf N or P levels over those found with phosphate alone (Table 2). Leaf K, magnesium, calcium and sulfur were not influenced by treatments and averaged 1.97%, 0.144%, 0.72% and 0.26%, respectively.
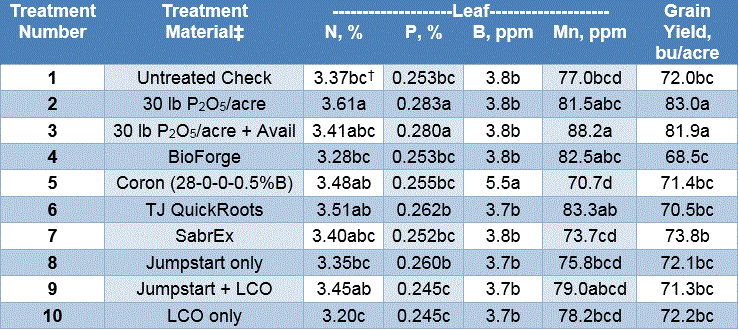 Table 2. Wheat flag leaf nutrient composition and grain yield as related to the treatments.
Among the micronutrients, flag leaf boron (B) was positively affected by Coron application, as expected (Table 2), while all other leaf B levels were not different from the untreated check. The leaf manganese response was complex, with the phosphate + Avail application resulting in the greatest leaf manganese concentration, though not significantly greater than those found with phosphate, BioForge, and the TJ Quickroots and Jumpstart + LCO seed treatments. Lowest leaf manganese was found with the untreated check, Coron, and the SabrEx and Jumpstart only seed treatments (Table 2). Leaf zinc, iron and copper were not influenced by treatments and averaged 18.5, 172 and 19.5 ppm, respectively.
At harvest, grain moisture and test weight were not affected by treatments, averaging 15.5% and 63.6 pounds per bushel, respectively. Grain yield was significantly influenced (+14.5% or +10.5 bushels per acre) by phosphate addition, relative to the untreated check, but phosphate + Avail did not improve yield relative to phosphate alone (Table 2). No other treatment, either foliar or seed, resulted in a yield significantly better than the untreated check (Table 2). The BioForge treatment resulted in the lowest observed yield.
Summary
In this study, there was a yield benefit to fertilizer phosphate, as recommended by the soil test P result. This benefit was not enhanced by Avail application to the phosphate fertilizer. The yield increase was due to improved wheat P nutrition. Of the two foliar treatments, there was no statistically significant benefit to BioForge application, relative to the untreated check, in any measured parameter, either leaf nutrient composition or grain yield. The Coron foliar application significantly increased wheat leaf boron concentration, modestly increased leaf N concentration, and modestly decreased leaf manganese levels, but did not benefit wheat grain yield.
Among the five seed treatments, none benefited plant stands or grain yield. Two of the seed treatments (QuickRoots, Jumpstart + LCO) tended to raise wheat leaf N, and two (Quickroots, Jumpstart only) tended to raise leaf P, but others (LCO only, Jumpstart only) tended to lower leaf N or (LCO only, Jumpstart + LCO) lower leaf P. Wheat grain yield responded positively to improved P nutrition, but was not benefitted by any of the other products.