Source: University of Illinois Extension
By Emerson Nafziger
Rainfall in April and May has been about average through most of Illinois, at least until the downpours the last days of May. This has allowed timely planting and a good start to the crop in most areas, and has allowed nitrogen (N) management to be carried out more or less as planned by most growers. Warm temperatures during some weeks of May are moving crop development along, and much of the N planned for application after crop emergence has already been applied.
Much of the rainfall has come with low or moderate intensity; there have been few multiple-inch downpours leading to standing water and fears of crop damage and of loss of N, though rain on May 30 has been heavy in places. But reapplying N late or using higher rates due to expectations of N loss happen every year, and while that might be less common this year, it remains a consideration.
To find out if more N is justified, we initiated a new study this year, funded by NREC, to “track” N applied at different times and forms to see how much N remains in the soil and available to the crop through the vegetative growth period.
At four research center sites in central and northern Illinois, we applied 200 pounds of N in four different ways: 1) as NH3 applied in November 2014; 2) as 100 pounds NH3 last fall, 50 pounds UAN at planting and 50 pounds UAN as V5-V6 sidedress; 3) as NH3 applied in early-mid April; and 4) as 50 pounds UAN at planting plus 150 pounds UAN at V5-V6 sidedress.
The 200-pound rate is higher than the N rate calculator rate, which is about 160 pounds N for corn following soybean. Our objective is to track N over time. Beginning after the fall application and about every 10 days this spring, we have been sampling soil to 2 feet deep, with samples analyzed for both nitrate and ammonium.
Figure 1 shows how much soil N (nitrate plus ammonium) we’ve found at the Urbana site in samples taken so far. Sampling like this always finds a fair amount of variability — we don’t know exactly where the N ended up in the soil, and soil probes don’t always get a representative sample. But we did find more N in plots where we had applied N, and we are able to see changes in soil N as the soils have warmed up and mineralization has kicked in.
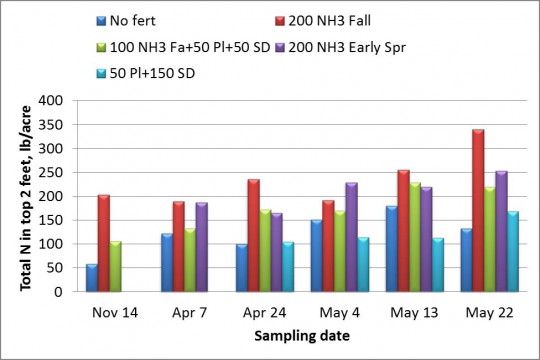 Figure 1. Soil N at different sampling times in an N-tracking trial at Urbana in 2015. Fall NH3 was applied before the November 14 sampling, early spring NH3 before the April 7 sampling, and planting-time applications (as UAN) were made before the April 24 sampling. Pl is planting time and SD is sidedress, which was done after the May 22 sampling. The 2014 crop was soybean, and corn was planted on April 23.
About as much fall-applied NH3 remains available as spring-applied NH3; both show at least 250 pounds of available N in the top 2 feet on May 22. We think this confirms that N losses have been small since last fall.
One surprise at this site has been the relatively large amount of N found in the soil where no fertilizer N was applied. In soils with a good amount of organic matter we never expect to find zero N, but we would not have expected to find the 130-180 pounds of N that we found in the last three (May) samples. Still, getting yields of 125-150 bushels per acre in corn following soybean without N fertilizer is not unusual, and so finding this amount of N may not be abnormal.
The findings at DeKalb and Monmouth are similar to those at Urbana, though the soil N levels are a little lower at the other sites, in part because they were last sampled a little earlier than at Urbana. Soil N without N fertilizer has reached only about 100 pounds per acre at those two sites. At the Perry site, with soils lower in organic matter, levels of soil N we have been finding are considerably less than at the other three sites; at the May 22 sampling at Perry, we found only about 150 pounds of soil N in both the fall- and spring-applied NH3.
The majority of the soil N is now in the nitrate form, regardless of what form was applied (Figure 2.) This is more or less as we expected for fall-applied NH3 and for spring-applied UAN, but by about 6 weeks after early spring NH3 application (done on April 6) we might have expected a little more of the N to still be in the ammonium form.
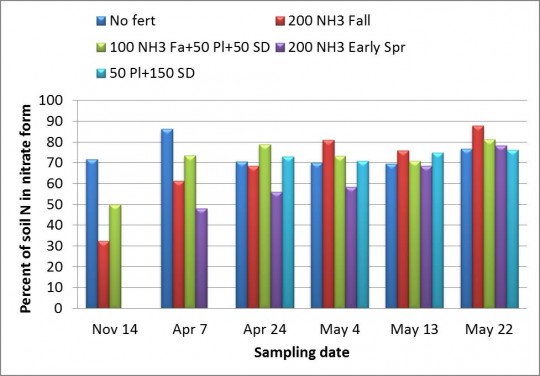 Figure 2. Percentage of soil N present as nitrate following different N treatments and at different sampling times at Urbana. The rest of the N was present as ammonium.
The takeaway message from what we’ve found so far in this project is that we see no reason to adjust upward the total amount of N applied due to concerns about N loss. The fertilizer N that was applied is mostly present as plant uptakes begin, and we can add to that the N coming from soil organic matter. It’s also encouraging that the amount we’re finding has continued to increase as we move into the N uptake period. Last year we found that the crop took up a total of less than 1 pound of N per bushel of yield, so we don’t see a shortage for the crop coming anytime soon.
As part of this project, we are also working with Dan Schaefer (IFCA) to sample several on-farm sites with similar treatments, and we’re sampling following spring N applications at two southern Illinois sites. More information on our findings will come in the following weeks.