By Jason Clark, Assistant Professor & SDSU Extension Soil Fertility Specialist
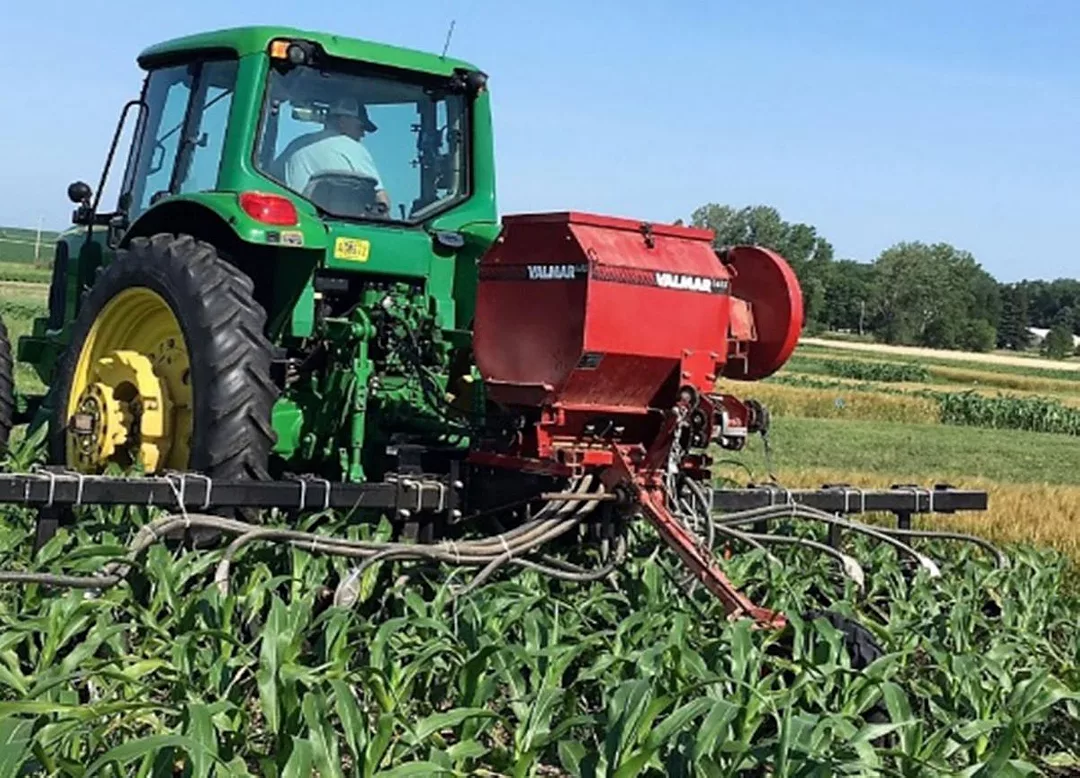
Pictured Above: Figure 1. High clearance planter used to interseed cover crops into corn and soybean.
Incorporating cover crops into our cropping systems and moving from conventional tillage to no-till can improve soil organic matter, soil structure, and water and nutrient holding capacity of our soils. These changes in our soils have the potential to reduce environmental degradation from the loss of fertilizers and improve crop yield. Inhibitions to planting cover crops in South Dakota (S.D.) are the short amount of time between harvest and the first killing frost that is available for cover crops to grow and the high seeding rate required to establish an optimal stand when seeds are broadcast planted. Using an interseeder (Figure 1) to plant cover crops overcomes these impediments because the seeds are placed in the soil and not on top after corn and soybean are established enough that cover crops will not decrease yield but before a planter cannot get into the field. This innovative method of planting cover crops lowers seeding rate requirements and increases the time cover crops are growing.
The cover crops farmers’ plant vary extensively from single grass species to mixtures of multiple grass and broadleaf species, depending on weather conditions and the cover crops intended use. The chosen cover crop can influence decomposition of organic N from organic matter into plant available forms of N (process called N mineralization) as cover crops take up water and nutrients and ultimately add organic material to the soil when terminated (McVay et al., 1989; Nielsen and Vigil, 2010; Wortman et al., 2012; Blanco-Canqui et al., 2015). Dominantly grass based cover crop mixtures normally have a greater C:N ratio, which may slow N mineralization initially during the growing season while broadleaf dominant mixes tend to have lower C:N ratios, promoting N mineralization sooner (McVay et al., 1989; Fageria et al., 2005). The amount and timing of N mineralization and availability of other nutrients during the growing season may change based on planted cover crop composition, subsequently influencing the N fertilizer amount required to optimize corn yield and the overall yield of corn and soybean.
Objective
- Compare the effect of no cover crop versus single- and multiple-species cover crops on N fertilizer requirement of corn.
- Determine the effect of single- and multiple-species cover crops on corn and soybean yield.
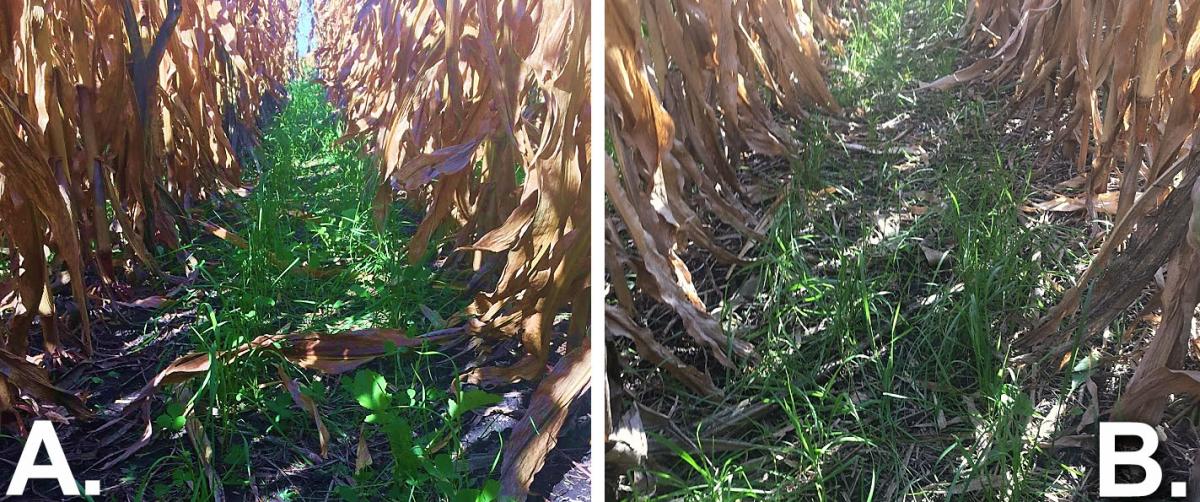
Figure 2. Single annual rye grass cover crop mixture (A) and a cover crop mixture that included annual rye grass, crimson clover, turnip, and radish (B) interseeded at the V6–V7 corn growth stage.
Methodology
LOCATIONS
Studies conducted at the Southeast Research Farm in Beresford, S.D. and at the USDA-ARS research fields in Brookings, S.D.
COVER CROP TREATMENTS
- Cover Crop Treatments (Figure 2): 1) no cover crop, 2) single grass species (annual rye grass planted at 20 lbs ac-1), and 3) grass/broadleaf mixture (annual ryegrass, crimson clover, turnip, and radish planted at 5, 3.5, 1, and 2 lbs ac-1, respectively).
- Cover crops were interseeded into corn at the V6–V7 growth stage and into soybean at the V4–V5 growth stage using a high clearance planter.
CORN ONLY N RATE TREATMENTS
Nitrogen rates ranged from 0–250 lbs ac-1 in 50 lb increments at the Beresford site and from 0–225 lbs ac-1 in 75 lb increments at the Brookings site.
PLANTING
Corn was planted in 30-in. rows at Beresford and 20-in. rows at Brookings at 31,000 corn seeds ac-1 and 130,000 soybean seeds ac-1. Corn was planted on 15 May in Beresford and 23 May in Brookings. Soybean was planted 23 May in Beresford and 14 June in Brookings.
Results
CORN YIELD
For the Beresford site, corn yield ranged from 142 to 235 bu ac-1 with a mean yield of 180 bu ac-1 across all treatments (Figure 3). The zero-N plots corn yield averaged 168 bu ac-1 regardless of cover crop treatment. The addition of N fertilizer (50–250 lbs ac-1) increased mean corn yield 7–33 bu ac-1 across the cover crop treatments. Overall, corn yield did not increase substantially with added N fertilizer as it would it most seasons. Therefore, we were not able to calculate an optimal N rate at this site. This lack of greater increase in corn yield with more N fertilizer applied may have been due to the high winds causing some stalk breakage during the growing season. In addition, within each N fertilizer rate there was no practical differences in corn yield among the three cover crop treatments.
For the Brookings site, corn yield ranged from 83 to 162 bu ac-1 with a mean yield of 132 bu ac-1 across all treatments (Figure 3). The zero-N plots corn yield averaged 92 bu ac-1 across cover crop treatments. The addition of N fertilizer (75–225 lbs ac-1) increased mean corn yield 49–66 bu ac-1 across the cover crop treatments. Corn yield plateaued near 75 lbs N ac-1 for all three cover crop treatments. Further, corn yields were similar among the three cover crop treatments within each N fertilizer rate.
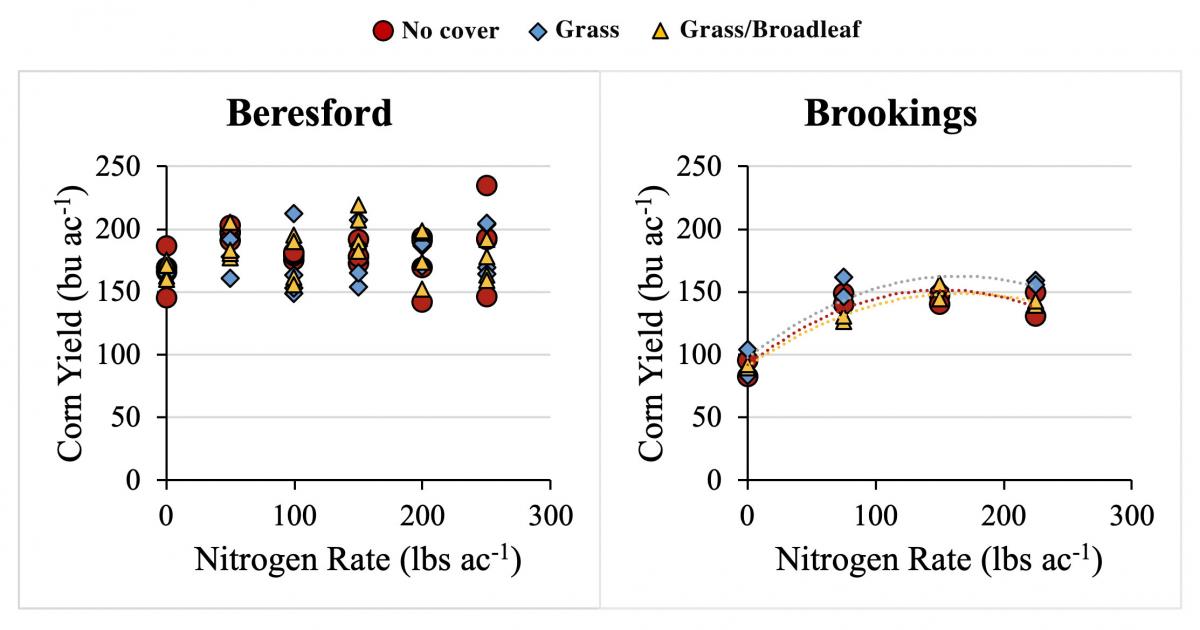
Figure 3. Corn yield response to N fertilizer for three cover crop treatments (no cover crop, annual rye grass alone, and a grass/broadleaf mixture) at Beresford and Brookings, S.D. in 2019.
SOYBEAN YIELD
Soybean yield ranged from 52 to 76 bu ac-1 with a mean yield of 66 bu ac-1 at Beresford and from 33 to 50 bu ac-1 with a mean yield of 40 bu ac-1 at Brookings across the cover crop treatments (Figure 4). At Beresford, the grass/broadleaf cover crop mixture compared to grass and no cover crop treatments resulted in a more variable effect on soybean yield. Although, when comparing the mean soybean yield of each cover crop treatment, there was only a 3 bu ac-1 difference (65 to 68 bu ac-1). At Brookings, mean soybean yield and variability were similar among the three cover crop treatments.
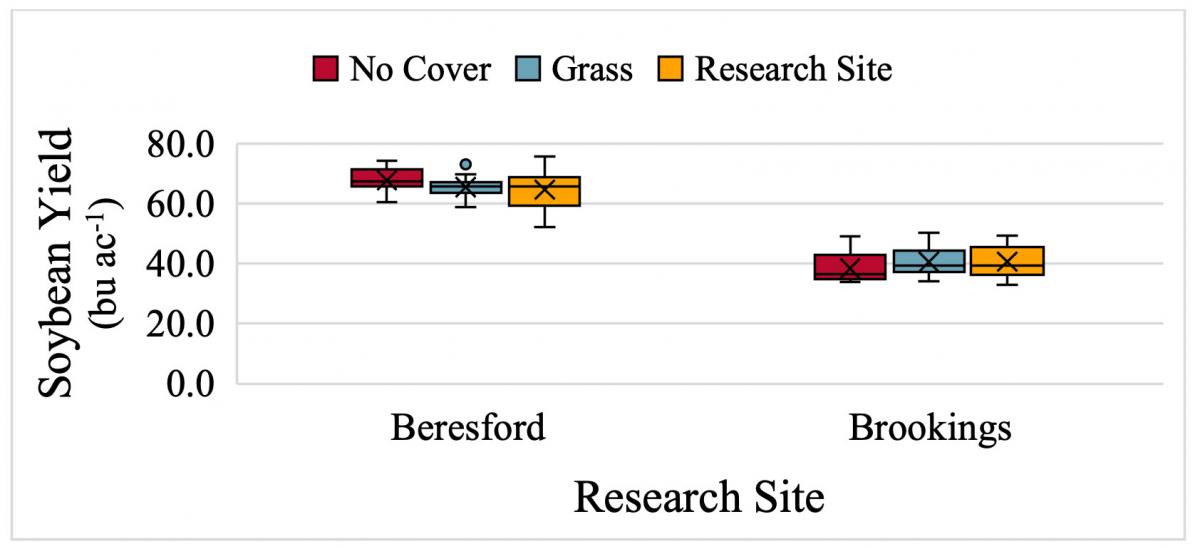
Figure 4. The influence of three cover crop mixtures on soybean yield at Beresford and Brookings, S.D. in 2019.
* The box midline represents the median, the ‘x’ marks the mean, the upper and lower edges of the box represent the 25th to 75th percentiles, the whiskers represent the range, and points outside the range represent outlier points that are >1.5 times away from either end of the box.
Conclusions From First Year
These results from the first year of this study indicate that grass or grass/broadleaf cover crop mixtures can be interseeded into corn and soybean without reducing yield or affecting N fertilizer required to obtain optimal corn yield. As this study continues, we will determine whether the cumulative effects of planting cover crops over several years will influence corn and soybean yield or N fertilizer required to obtain optimal corn yield.
Acknowledgements
Research funded by the S.D. Nutrient Research and Education Council. Authors appreciate the support of the S.D. Agricultural Experiment Station and USDA-NIFA. Nitrogen fertilizer provided by LSB Industries.
References
- Blanco-Canqui, H., T.M. Shaver, J.L. Lindquist, C.A. Shapiro, R.W. Elmore, C.A. Francis, and G.W. Hergert. 2015. Cover crops and ecosystem services: Insights from studies in temperate soils. Agron. J. 107(6): 2449–2474. doi: 10.2134/agronj15.0086.
- Fageria, N.K., V.C. Baligar, and B.A. Bailey. 2005. Role of cover crops in improving soil and row crop productivity. Commun. Soil Sci. Plant Anal. 36: 2733–2757. doi: 10.1080/00103620500303939.
- McVay, K.A., D.E. Radcliffe, and W.L. Hargrove. 1989. Winter Legume Effects on Soil Properties and Nitrogen Fertilizer Requirements. Soil Sci. Soc. Am. J. 53: 1856. doi: 10.2136/sssaj1989.03615995005300060040x.
- Nielsen, D.C., and M.F. Vigil. 2010. Precipitation storage efficiency during fallow in wheat-fallow systems. Agron. J. 102: 537–543. doi: 10.2134/agronj2009.0348.
- Wortman, S.E., C.A. Francis, M.L. Bernards, R.A. Drijber, and J.L. Lindquist. 2012. Optimizing cover crop benefits with diverse mixtures and an alternative termination method. Agron. J. 104: 1425–1435. doi: 10.2134/agronj2012.0185.