By R.L. Nielsen, Agronomist
Even if grain yield monitor calibration, adjustments and operation are faithfully conducted, the resulting yield data sets almost always require some post-harvest processing and "cleaning" procedures to rid the data set of anomalies and "gremlins.” Failure to do so does not result in catastrophe, but contributes to errors in subsequent spatial analysis and interpretation of the data. Farmers can conduct these harvest data processing and "cleaning" procedures themselves with commercially available mapping software or outsource the tasks to a service provider.
Doing it yourself requires the software (an expense) and the knowledge to operate the software (time and talent). Commercially available mapping software programs vary in their processing and "cleaning" capabilities, flexibilities and user-friendliness. Consequently, doing it yourself can be a rewarding challenge or a frustrating task.
Outsourcing the task involves some expense (up front or hidden in other service fees) and trust that the service provider knows what they are doing. Automatic, wireless uploads of yield data directly from the combine to a cloud-based service does not always include the assurance that the yield data will be further processed or "cleaned.” The data may simply be stored and/or added to a larger aggregation of "big data" with no further processing or "cleaning.”
Common post-harvest data processing steps include choosing correct settings for dry bushel moisture value, dry bushel weight, stop/start time delays (affect estimated total harvest area), grain flow lag (time from header to sensor, affects positional accuracy of point data) and GPS offsets (distance from GPS antenna to header, affects positional accuracy of point data). These various settings influence the accuracy of the estimates of dry bushels per acre and the spatial accuracy of the yield data points with respect to their geo-location within the field. When yield data are properly processed, patterns of spatial yield variability are often more clearly identified (Fig. 1 before processing vs. Fig. 2 after processing)
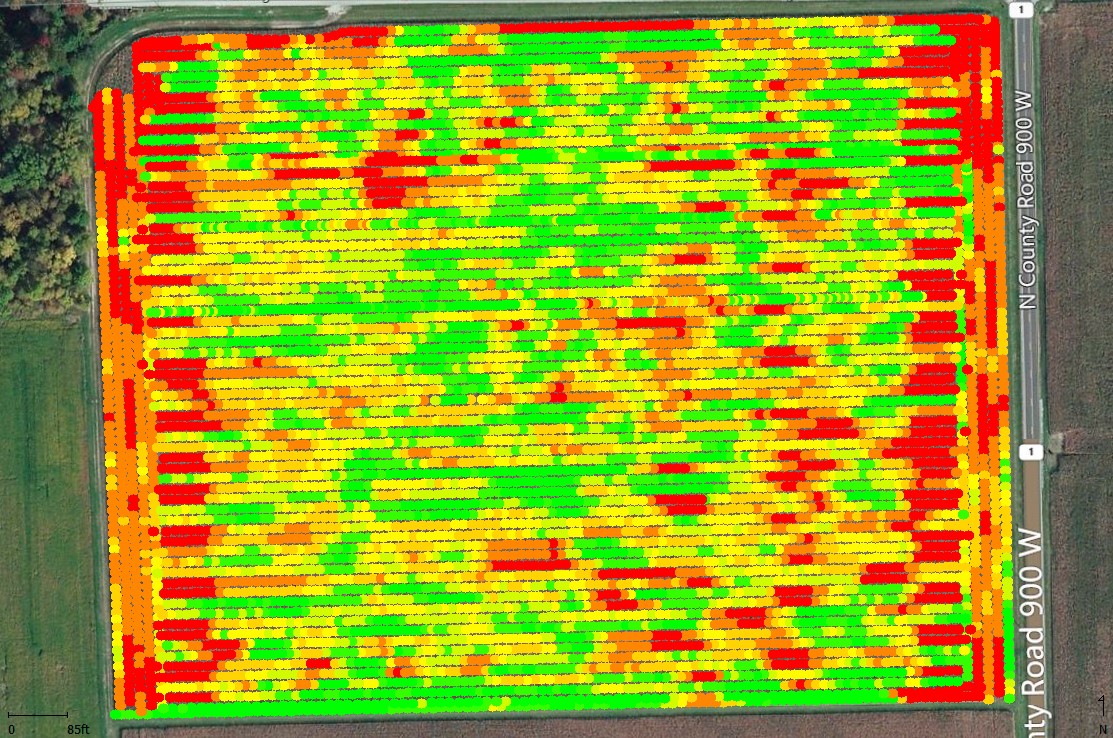 Fig. 1. Map of yield data incorrectly processed for start/stop delays and grain flow shift. Colors: Green = highest yields; Red = lowest yields. Davis-Purdue Ag Center, Field M1 (30-ac), 2015 corn harvest.
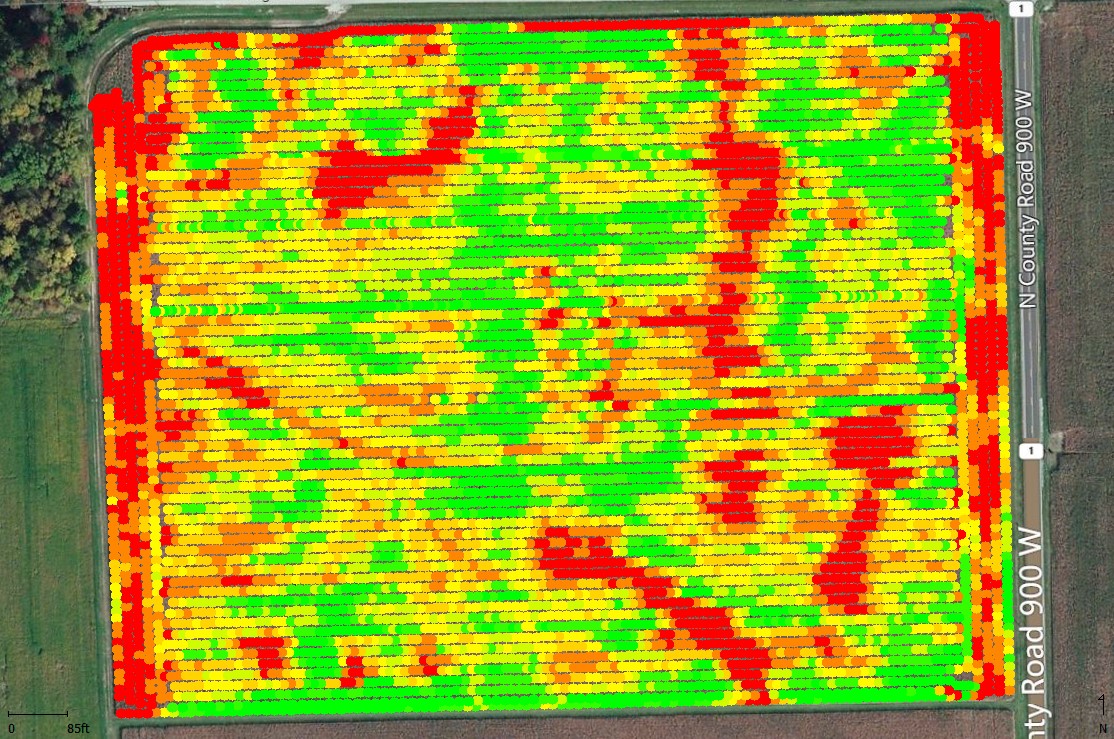 Fig. 2. Map of yield data correctly processed for start/stop delays and grain flow shift. Colors: Green = highest yields; Red = lowest yields. Davis-Purdue Ag Center, Field M1 (30-ac), 2015 corn harvest.
Some yield monitors (particularly newer models) allow these settings to be made in the monitor display prior to harvest. Others do not and so the yield data requires using mapping software to retroactively set the values and "reprocess" the data. Not all mapping software programs provide the same options for reprocessing of yield data. Not every proprietary yield file format lends itself to reprocessing.
Other anomalies and "gremlins" in yield data may literally be inaccurate point yield estimates caused by inadvertent quirks of the yield monitor system (e.g., sudden speed changes, incorrect auto-swath widths, imprecise DGPS signals and the normal grain flow dynamics inside the combine). Yield data attributes like swath width, harvest speed and DGPS signal quality can be displayed by your mapping program just like you do for yield itself. Mapping these attributes helps you more clearly visualize the location and extent of the anomalies.
Some "gremlins,” like incorrect swath widths, can be corrected during the reprocessing steps of the mapping software so that bushels per acre are recalculated accurately (Nielsen, 2014b). Other anomalies that do not directly impact yield estimates, such as incorrect assignment of hybrid labels to the yield data (Nielsen, 2014a), can be corrected with your mapping software by editing the yield file, manually selecting groups of yield data points, and replacing the hybrid label with the correct ones. True anomalies and "gremlins" (e.g., data points associated with sudden speed changes, inadvertent "header down" data points) should simply be deleted from the data set to avoid interference with your spatial interpretation of the data.