By Jennifer Thomas-Muprhy
We have conducted numerous studies over the last 10 years on soybean seeding rates. In almost all instances, we rarely observed a response to rates above 150,000 seeds per acre.
In 2015, we examined the response of soybean under high input management (~200,000 seeds per acre with a fungicide/insecticide seed treatment as well as a foliar fungicide, Priaxor, applied at 4 fluid ounces per acre on July 31 at the R3 stage) compared with recommended input management (150,000 seeds per acre with a fungicide/insecticide seed treatment). This was part of a larger study comparing the response of all the crops in the corn-soybean-wheat/red clover rotation under conventional and organic cropping systems with recommended or high input management. We described this study in detail in a news article in the last What’s Cropping Up? issue of 2015.
In that article, we reported that soybean under high input management in the conventional cropping system yielded 48.6 bushels per acre, when averaged across three previous 2014 crops, compared with 44.7 bushels per acre under recommended management inputs. We did note in the previous article that despite the 9% yield increase, partial profit was not significantly different between the two treatments because the added input costs for seed and fungicide, as well as the fungicide application cost, offset the 3.9 bushel/acre increase for $8.50 soybeans.
Still, why did we get a yield response to high input management in the conventional cropping system? Climatic conditions were exceedingly dry from the day of fungicide application through harvest (1.4 inches of precipitation in August and 1.35 inches from Sept. 1-20). Consequently, visually discernible disease symptoms were absent on the visible portion of soybean foliage from the R3-R8 stage.
Nevertheless, because we almost never observe a response to a seeding rate of 200,000 seeds per acre compared with 150,000 seeds per acre, we speculated that perhaps the fungicide and not the higher seeding rate provided the 9% yield increase. In addition to disease control, there is some speculation that a fungicide application may improve overall soybean health, independent of disease presence.
Yield component analyses help explain why there was a yield response to high input management of soybean in the conventional cropping system in 2015. In each soybean plot (planted in 15-inch rows), we sub-sampled the four center rows in two 1-meter lengths (1.52 square meter area) about 5 days before the Sept. 23 soybean harvest of the entire plot with a plot combine. We hand-harvested all the plants in the sub-sampled area and dried them, pulled off the pods and counted them, ran the pods through a stationary thrasher, counted the seeds that were thrashed and weighed all the seeds (~3,500-4,500 seeds per sample or ~7,000-9,000 seeds per plot).
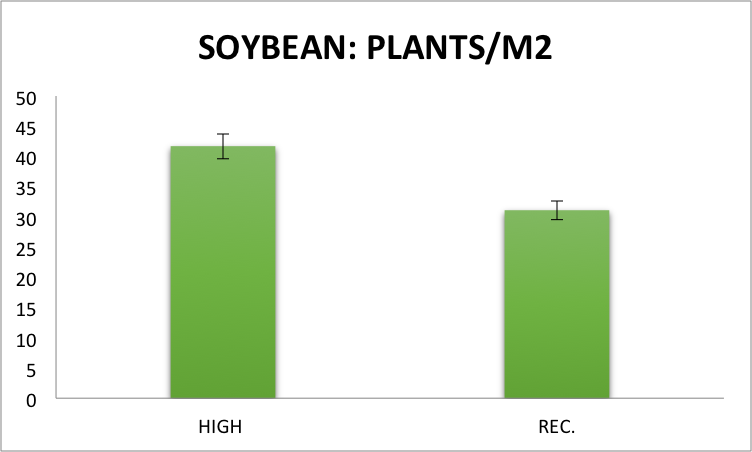 Figure 1.
Soybean populations of the subsampled regions immediately before harvest, however, are only 2.9%-3.2% different than at the V2 stage, so we believe that our subsampled measurements represent the entire plot extremely well.
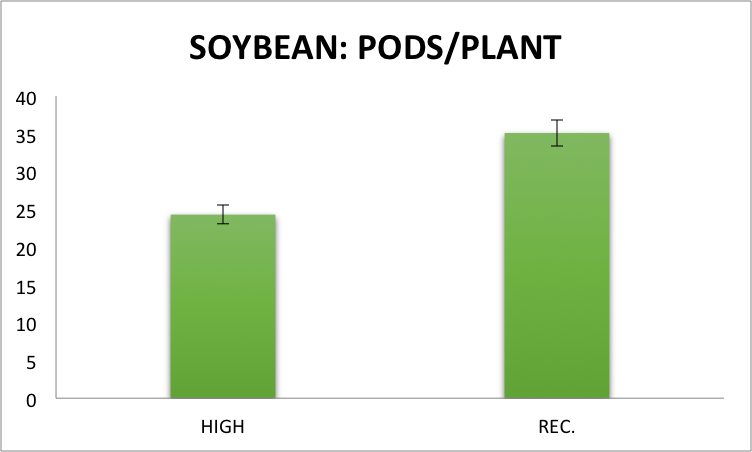 Figure 2.
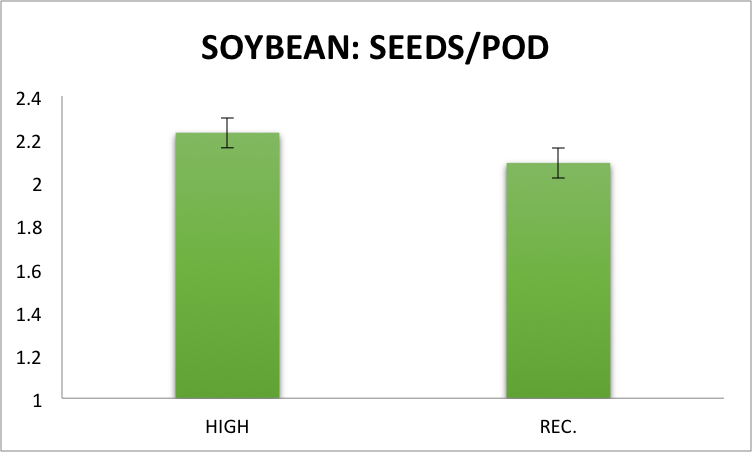 Figure 3.
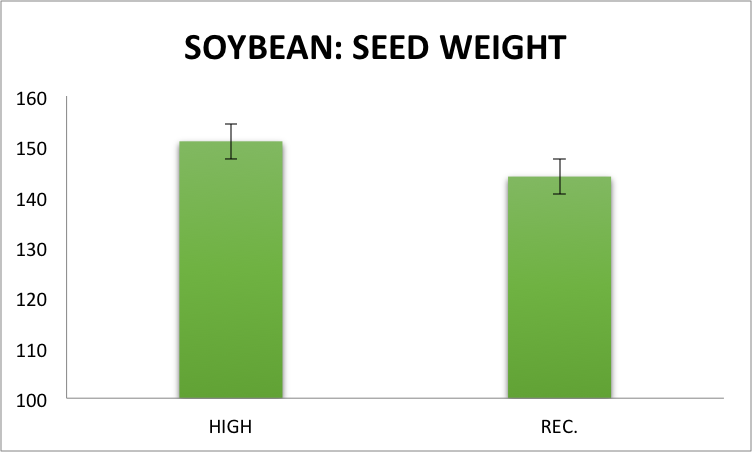 Figure 4.
We did not, however, observe delayed senescence in the high-input management compared with the recommended-input management treatment. (It is possible that the higher plant populations offset a potential fungicide effect on delayed senescence.)
If you multiply out the yield components (plants/m2 x pods/plant x seeds/pods x seed weight), the subsample yields averaged 51.1 bushels per acre in the high-input management compared with 49.0 bushels per acre in the recommended input management treatments. The subsample yields were ~5-10% greater than the actual plot yields, and the difference in yield between treatments was only 4.3% instead of the 9% difference in plot yields.
Nevertheless, we feel that the subsampled data provide us with insight on how soybean responded to high-input management (fewer pods per plant with higher seeding rates and more seeds per pod and seed weight perhaps because of the fungicide application?).
We will continue this study for 2 additional years to see if there is indeed a response to fungicide application in the presence of high seeding rates. Currently, it is pure speculation that a fungicide application at the R3 stage resulted in more seeds per pod and greater seed weight in soybean.
Nevertheless, an increase in seeds per pod and seed weight would be the two most likely yield components that an R3 fungicide application would affect. As noted previously, the 9% yield advantage did not result in an increase in partial profit. Furthermore, we avoided the harvest rows when applying the fungicide application at the R3 stage. In a production field, an R3 fungicide application would probably result in some yield reduction, associated with mechanical damage of the crop, especially with spray booms less than 90-120 feet in width, reducing the magnitude of the potential yield response.
We are looking forward to 2 more years of research on this topic.