By Steve Culman, Greg LaBarge, Ed Lentz, Harold Watters
Soil sampling for lab analysis is a critical aspect of effective nutrient management, as it provides valuable information on the fertility status of your soil. Many growers find that fall is an ideal time to sample soil for several reasons:
- Soils often have an ideal moisture range that makes sampling easy.
- It gives producers ample time to apply fertilizer or lime before the next crop.
- It helps ensure spring planting will not be delayed.
Of course, soils can be sampled at other times of the season, most commonly in the spring before planting. But how will soil sampling at different times of the year affect your soil test results?
A study from the University of Kentucky Extension found that soil values will vary seasonally, and that they tended to be lowest in the fall. To see how this compared with Ohio soils, we conducted a small study to compare differences in spring vs. fall sampled soil.
We sampled soils last fall and this spring from a long-term fertilizer trial at three Ohio State University research farms in Clark, Wayne and Wood Counties. We sampled soils from 0-8 inches from 36 plots at each site. The sites were in corn-soybean rotations and we sampled in the fall after corn harvest and in the spring before soybean planting. No amendments or fertilizers were added in between samplings. Clark and Wood Counties were chisel tilled in the fall and Wayne County was chisel tilled in the spring.
We had a standard soil test run with a Mehlich-3 extraction. To compared the spring vs. fall values, we calculated the relative percentage by:
(Spring Sampled/Fall Sampled) x 100
Table 1 shows these relative percentage values. Values over 100 indicate greater soil test values in the spring sampled soil, while values less than 100 indicate greater soil test values in the fall sampled soil. Soil pH and cation exchange capacity (CEC) were the only two measurements to show consistent bias across sites. Spring sampled soil had consistently higher pH values and consistently lower CEC values. Organic matter, phosphorus and base cations showed different trends depending on the site.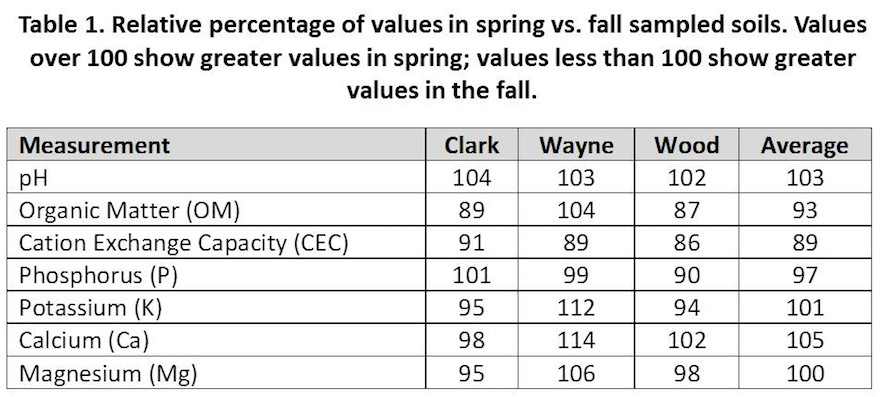
Although there was a lack of consistent trends across the sites, within any given site, there were trends of increased values with fall or spring sampled soil. Figure 1 shows spring vs. fall sampled relationships with a 1:1 line. Points falling above this line indicate greater values in the spring and points falling below the line indicate greater values in the fall. These trends underscore the importance of consistently sampling at the same time of the year to get the most meaningful information from your soil tests.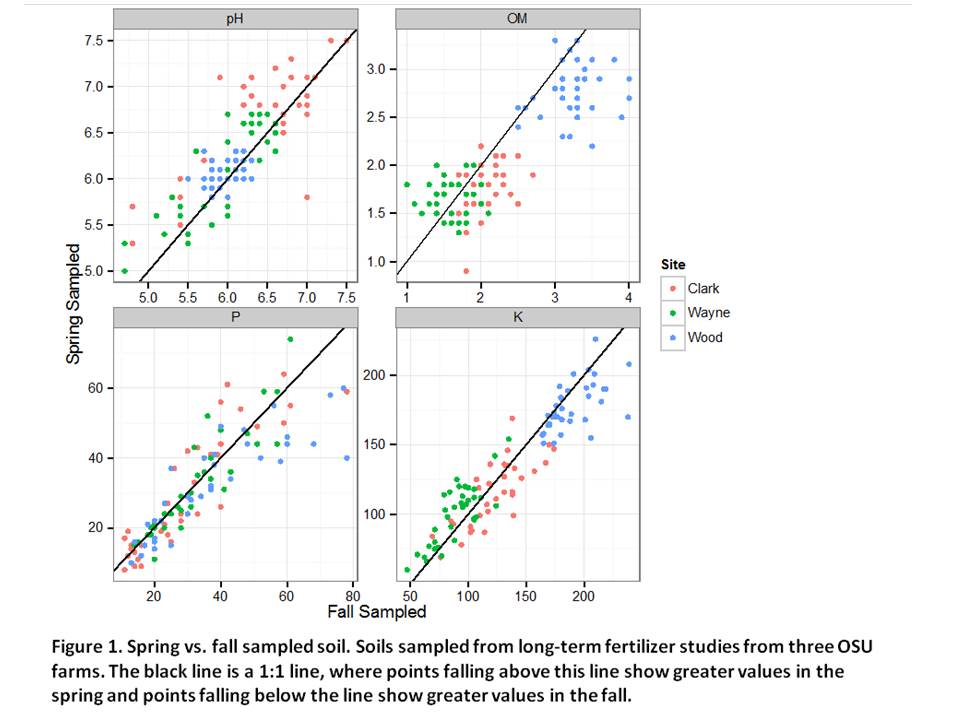
There are many factors that can influence your soil test results. Time of the year soils were sampled is only one of them. Discussion of other factors can be found here: Soil Sampling to Develop Nutrient Recommendations.