By Dennis O’Brien, USDA-Agricultural Research Service
When crops get thirsty, they get hot. Scientists can use canopy temperatures to determine if crops are water stressed.
An Agricultural Research Service engineer in Colorado has found a way to simplify this process for farmers. The goal is to manage irrigation water more effectively in an area where saving water has become a top priority.
A key to Kendall DeJonge’s research in Fort Collins is the use of infrared radiometric thermometers (IRT), affordable sensors that can determine the crop canopy temperature, and subsequently whether a crop is water-stressed.
IRTs can be placed on field posts or center pivot irrigation systems to gather hourly or daily temperature readings on crops. Scientists interpret the IRT data by using one of several indices, including the commonly used Crop Water Stress Index (CWSI).
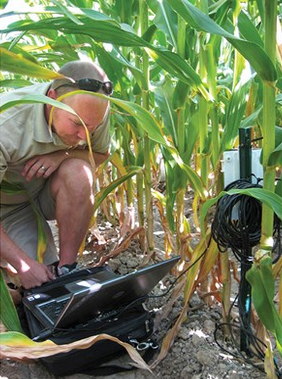
Agricultural engineer Kendall DeJonge, with the ARS Water Management Research Unit, downloads canopy temperature data at a research plot near Greely, Colo.
Developed by ARS scientists in the early 1980s, the CWSI requires knowing air temperatures and humidity levels to calculate a “vapor pressure deficit,” in addition to knowing the canopy temperature.
The process is fairly technical and requires additional measurements, so many farmers in Colorado instead just “guesstimate” when irrigation is needed. In some cases, farmers will either over-irrigate and waste water or under-irrigate and reduce yields. Providing farmers with a simple yet effective method of monitoring crop water needs is key.
Population growth and droughts have made water a critical issue in Colorado, and DeJonge says using IRTs to determine crop water needs just makes sense. “With water becoming more precious, we need to exploit the potential of every tool available,” he says.
DeJonge and his colleagues compared the CWSI with five other “indices,” or formulas, for interpreting IRT data, to see how well they could detect crop water stress over 2 years in a corn-sunflower rotation.
All of the indices used crop canopy temperatures to determine water stress levels. The CWSI, often considered the gold standard for quantifying water stress, also required air temperature and humidity data.
Two of the indices developed for the study were simpler than CWSI, including the Degrees Above Non-Stressed (DANS) index and the Degrees Above Critical Temperature (DACT) index.
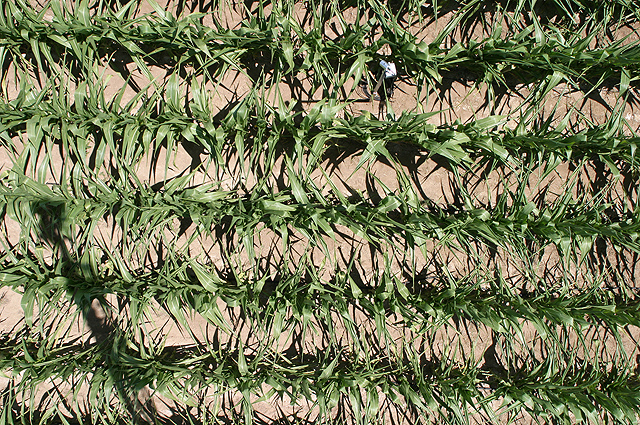
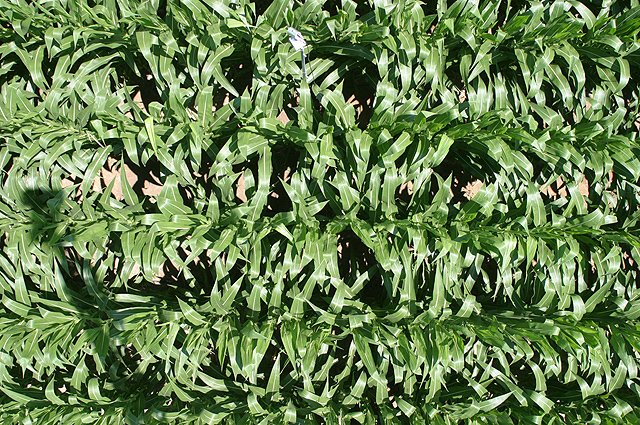
At left, an overhead view of water-stressed corn crop, while at right, an overhead view of a non-stressed corn crop.
DANS is calculated by comparing a stressed plant’s temperature to the temperature of a non-stressed plant in the same environment. DACT is based on an established crop temperature threshold, with plant water stress determined by how many degrees above that threshold the plant temperature reaches.
Crop canopy temperatures for DANS and DACT were taken each day at 2 p.m., when water stress levels were usually highest. The researchers monitored soil water levels and crop water use, and fully irrigated part of the field, while intentionally stressing other areas, some moderately and some severely. All the while, the IRTs continually measured crop canopy temperature.
The findings showed that the DANS and DACT indices were just as effective as CWSI at determining water stress even though they require much simpler measurements: a once-a-day reading of crop canopy temperatures.
DeJonge plans to develop “crop water coefficients” that establish water needs of specific crops under different scenarios. With that data, IRTs could soon be widely used by farmers. DeJonge foresees farmers using handheld IRTs in the near future, and eventually using IRTs with drones to calculate water needs over extensive areas.