Variations in soil properties and topography changes across production fields impact crop growth and management strategies. Compared to the whole-field management, zone management optimizes input utilization, improves agricultural productivity and leads to site-specific management on a smaller-scale area. Site-specific management based on needs improves farm profits, soil health and environmental quality.
The first step to practicing zone management is to identify the variations that control yield. Variation in soil properties is one of the most-influential factors impacting crop yields. There are various methods for characterizing soil variations within a field, and among them, electrical conductivity (EC) measurement is one of the fastest, most-reliable and cost-effective methods. As a static and steady parameter, soil EC measurements provide information about soil texture, cation exchange capacity (CEC), drainage conditions, organic matter level and salinity.
Measuring the Soil Electrical Conductivity
There are two types of commercially available EC mapping systems in the field: contact and non-contact systems. To distinguish the EC measured by the Veris unit from the soil science definition of EC (based upon conductance of a saturated soil paste extract), we will call the Veris and EM38 EC measurement apparent EC (ECa).
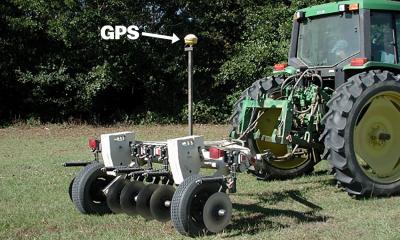 Figure 1. Veris 3100, the contact-type EC sensor (Veris Technologies, Salina, Kansas). Types of data: Deep signal (36 inches) and shallow signal (12 inches).
This type of sensor uses coulters as the contact electrodes to contact with soil. In this system, one or more pairs of coulters are mounted on a toolbar to contact with soil and send an electrical current into the soil (transmitting electrodes), while the other coulters (receiving electrodes) read the voltage drop. Soil ECa data is stored in a logger with the related location data stamp using a global positioning system (GPS).
For example, Veris 3100 (Figure 1) provides shallow and deep ECa readings from soil (shallow is one foot and deep EC is three feet). A smaller model (Veris iScan) can be mounted to a planter or tillage equipment. The distance between measurement passes ranges from 20 to 60 feet, depending on the desired sampling density or soil variability within the field.
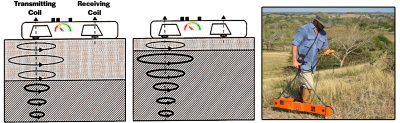 Figure 2. EM 38 is a non-contact EC sensor, with no contact to the soil. It uses electromagnetic induction to send electromagnetic waves into soil, and from there we measure the EC. Types of data: Deep signal (40 inches) and shallow signal (12-14 inches).
The non-contact ECa sensor uses the electromagnetic induction principle instead of direct contact into the soil (Figure 2), measuring the voltage drop between a source and a sensor electrode (metals would cause interference on the performance). EM38 (Geonics Limited), DUALEM, and GEM-2 (Geophex) are popular models of non-contact sensors. The collected data from contact and non-contact machines are similar, and from both, we get two types of readings or signals. One is shallow or root zone readings and another deep ECa readings, which provide information related to deeper soil conditions.
Correlation of Soil ECa and Crop Yield
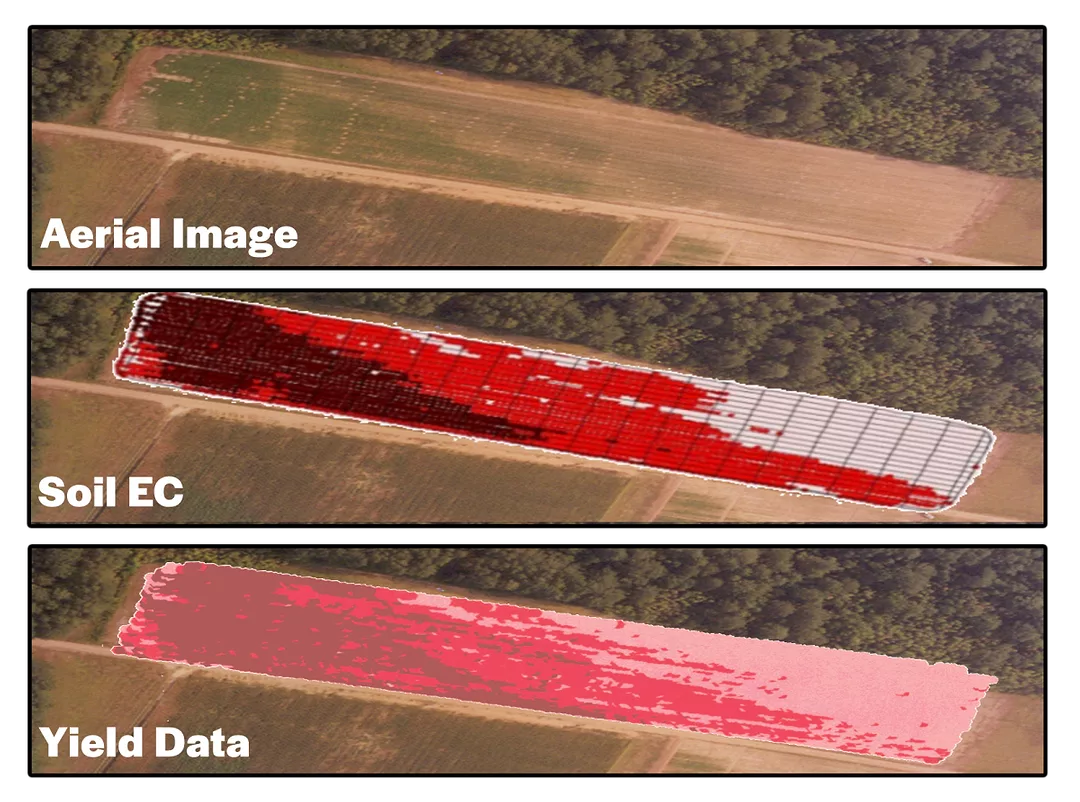
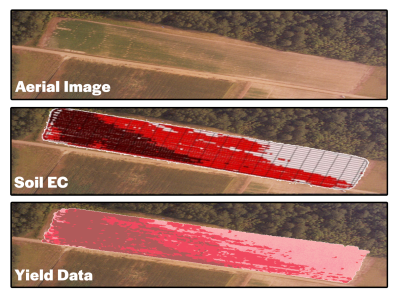 Figure 3. Aerial imagery, EC data and the yield data for a field have a good correlation. If the data and information are collected correctly, any one of these can give you an idea about your field conditions.
Soil ECa has shown a good correlation with soil properties that affect crop productivity and yield. After precision farmers create yield maps and conduct a preliminary evaluation of the yield response, they will identify the manageable causes of crop yield response.
Differences in soil properties are the most-apparent reasons for yield variability. Soil ECa has the potential to estimate variations in some soil physical properties in a field, and yield maps are frequently correlated to soil ECa (Figure 3).
Based on ECa data, sandy soils with low organic matter have low EC, silts have medium and clays have higher EC. Soil EC is a way to measure soil texture, sand, silt and clay. The finer particles of clay conduct more electricity than coarser silt and sand particles. Thus, higher clay results in higher EC, while higher sand results in lower EC.
ECa data are often validated by soil sampling and yield data to determine an accurate variable rate of inputs.
In many situations, these similarities are explained through differences in soil. The soil's water-holding capacity is a major factor affecting yield, and the yield map will likely show a strong correlation to the soil ECa. In general, soil ECa maps may indicate areas where further exploration is needed.
Most likely, soil ECa maps give valuable information about soil variations and similarities, making it possible to divide the field into smaller management zones. Zones with consistent ECa readings are areas with similar soil properties and may be grouped together for soil sampling and management.
Application of Soil EC Maps
- Identifying management zones, generating prescription maps and decision support.
- A better interpretation of yield maps and improving prescription maps.
- Weed and diseases management (less herbicide in sandy soils and identifying disease outbreak areas).
- Tillage, drainage and irrigation decisions.
- Research and plot work improvement.