
No-Till Farmer
Get full access NOW to the most comprehensive, powerful and easy-to-use online resource for no-tillage practices. Just one good idea will pay for your subscription hundreds of times over.
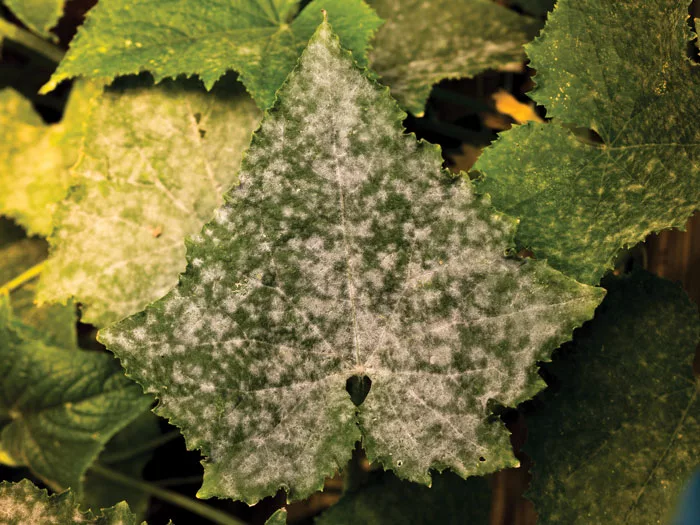
SAP ANALYSIS SOLVES MILDEW MYSTERY. John Kempf says it’s well established that powdery mildew in cucurbit crops, as seen on this cucumber leaf, is primarily driven by a manganese deficiency. Yet dry matter-based tissue testing never showed resistant crops as having higher manganese levels or infected crops as having less. Only when Advancing Eco Agriculture switched to plant sap analysis did they see an accurate correlation between powdery mildew and manganese.
What if you could decrease your nitrogen (N) and potassium (K) applications — anywhere from 30-70% — while increasing yields and crop health? That’s what John Kempf found from managing nutrition properly on many of the farms he works with, thanks to plant sap analysis
The owner and founder of Advanced Eco Agriculture (AEA), a crop consulting and specialty plant nutrition and biological products company, turned to plant sap analysis after growing frustrated that dry matter-based tissue test results were not correlating to what he was seeing in the field. After trying plant sap analysis, he quickly discovered that this new nutrient-testing technology out of the Netherlands provided a much more accurate picture of what was happening inside the crops and can save growers thousands of dollars in fertilizer costs.
Plant sap analysis is similar to tissue sampling in that growers need to collect leaves from the plant. However, Kempf explains that they need to take fresh leaves from two locations: a young, fully mature leaf on the plant — same as a tissue test — and an older leaf that’s still green and photosynthesizing.
“It’s very important to take samples from two locations and measure them separately because, as we all know, nitrogen and potassium in particular, and several other elements also, are very mobile,” Kempf explains. “They move around in the plant very quickly. And when the plant begins experiencing low levels of either nitrogen or potassium, it pulls it out of the lower…

Get full access NOW to the most comprehensive, powerful and easy-to-use online resource for no-tillage practices. Just one good idea will pay for your subscription hundreds of times over.
Download these helpful knowledge building tools

We have engineered and developed the most advanced concave system that threshes all crops, eliminates rotor loss, improves grain quality, gives you a cleaner sample – all with one set of XPR concaves.
At Titan International, our product portfolio reflects our commitment to innovation and high-quality products. Titan International offers a full line of solution-focused wheel, tire, and undercarriage products for a wide variety of off-the-road equipment in agriculture, construction, forestry, mining, power sports, high-speed trailers, and outdoor power equipment segments. As one of the largest North American manufacturers, with a network of dealers all over the world, Titan is an industry leader that original equipment manufacturers and operators can count on for durable products and quality service.

Provide expert analysis and decision support to increase productivity and profitability.