Today, I want to call attention to some interesting information posted by Pam Knox with the University of Georgia Extension Service.
I follow several ag and climate blogs to try and keep up on what folks around the country are seeing and saying about climate change, agriculture and natural resource issues. One of my favorites is “Climate and Agriculture in the Southeast” created by the above mentioned Pam Knox with the University of Georgia. Pam puts out timely and interesting information about the impact our changing climate is having on agriculture in the Southeastern portion of the country — so interesting and timely in fact that I am going to steal the information she had on one of her latest posts.
In her October 6 blog, Pam highlighted one of several maps created by ProPublica in 2020 showing some of the likely changes in climate over the next 50 years as the earth gets warmer. This map also has a way for you to search for your home county to see what potential changes may be in store.
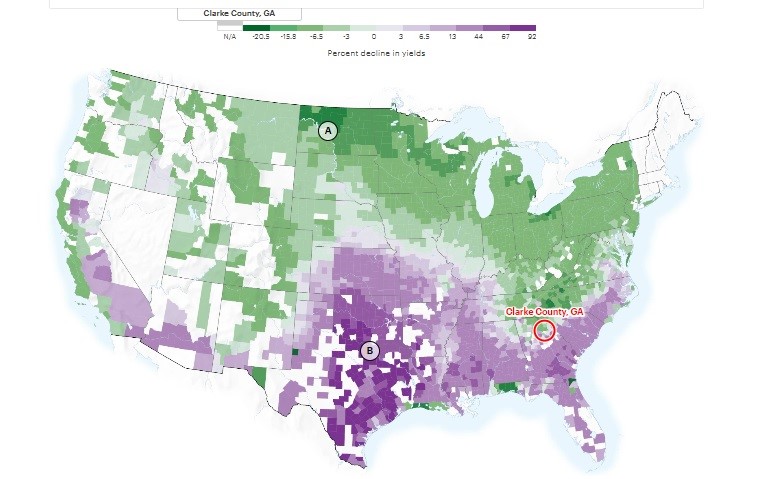
Fig. 1 ProPublica storymap from 2020.
Here is a picture of the potential outlook for crop yields…
If you are having a hard time reading the map, let me break it down…the more purple your county, the worse it will be (when it comes to yields). In fact, according to ProPublica, which based its map on a paper published by the National Academy of Science, we could be looking at yield drops in Oklahoma and Texas as much as 60-70% over the next 50 years.
That’s a fun thing to look at right in the middle of wheat planting…….
Anyway, if you get a chance, check out Pam’s blog (and the map). It’s great information and gives you some food for thought.