The N-rich strip method allows wheat producers a greater window of decision making regarding the application of nitrogen (N) fertilizers. Besides having greater accuracy in N rates than standard methods (based on the SBNRC – OSU) also helps to reduce costs in the production system and to preserve the environment avoiding over N applications.
With the experiments performed in the last two crop seasons (2016/18 and 2017/18), we can now be even more accurate with regard to the best application time to increase the N use efficiency by the crop. The objective of our study was to determine the impact of prolonged nitrogen deficiency on winter wheat grain yield and protein. Eight studies were conducted with 11 N application timings in no-till dryland conditions. A pre-plant treatment of 90 lbs ac-1 of N was broadcast applied as ammonium nitrate (AN). We used AN as our source because we wanted to measure the crops ability to recover and eliminate the impact of source efficiencies. When visual symptom differentiation (VSD) was documented between the pre-plant and the non-fertilized check, i.e the N-Rich Strip showed up, top-dress applications were performed every seven growth days (GDD> 0) (https://www.mesonet.org/index.php) until 63 growth days after VSD at all sites. The only N the treatments received where applied according to treatment structure. No preplant N was applied other than trt 1, and all locations had residual N under 15 lbs 0-6” sample.
The first visual response to fertilizer N ranged from November 11 to February 5 (Table 1). The soil can have residual N from the previous season which can supply the subsequent crop in the beginning of the development what makes the wheat not demonstrate any sign of stress in the early season. For example LCB2017 a and b which were located 100 yards apart but under a different point in the crop rotation (LCBa was wheat after wheat and LCBb wheat after canola) had a 30 day difference in date of first N response. This range in first and last dates allowed us to evaluate N application over a wide range of dates and determine whether the first sign of stress is actually the best indicator of top dress application timing.
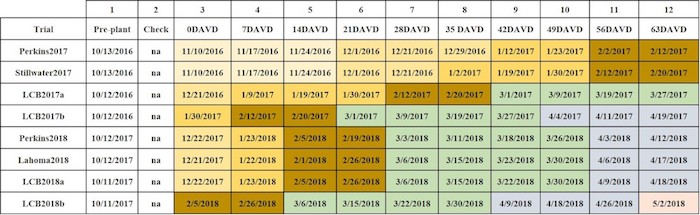
TABLE 1 SHOWS THE PLANTING DATE, DATE OF FIRST VISUAL DIFFERENCE (0DAVD) AND EACH OF THE APPLICATION DATES FOR ALL LOCATIONS. DIFFERENT COLORS REPRESENT INDIVIDUAL MONTHS. HOLLOW STEM OCCURRED APPROXIMATELY FEB 20 IN THE 2017 CROP AND MARCH 10TH IN THE 18 CROP.
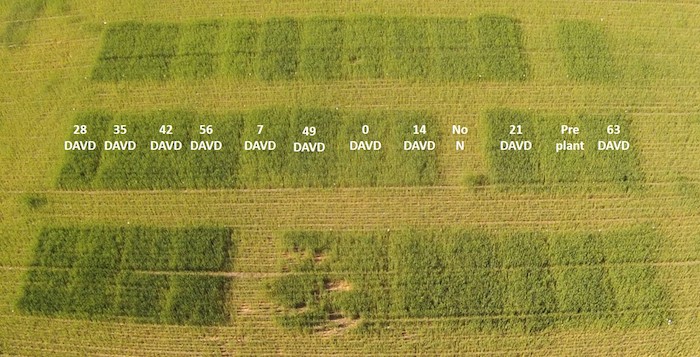 IMAGE OF THE 2016-17 PERKINS LOCATION. IMAGE COLLECTED MARCH 21 2017.
As shown in the Tables 2 and 3 below only three of the 78 comparisons made back to the pre-plant application were significantly less in terms of grain yield. All three of these comparisons where from when N application was delayed until late March or April. When the delayed applications were compared to 0DAVD yields only two of the 68 comparisons showed a significant decrease on yield. One was the pre-plant application for LCB2017a while the other were the 63DAVD application for LCB2017b. In most locations applications made in March yields were at the highest point, however when delayed till April yield trends on the downward trend. The 2017 crop reached hollow stem (Feekes 6) around Feb 20th while the 2018 crop reached hollow stem around March 10th.
Grain protein concentration was decreased only once when compared to both the pre-plant and 0DAVD treatments. This one timing, LCB2018b 64DAVD, was the only application made in May. During this time the crop was in the early stages of grain-fill. In all locations delaying N application until February/March increased grain protein content above the check, and in most cases above the 0DAVD trt.
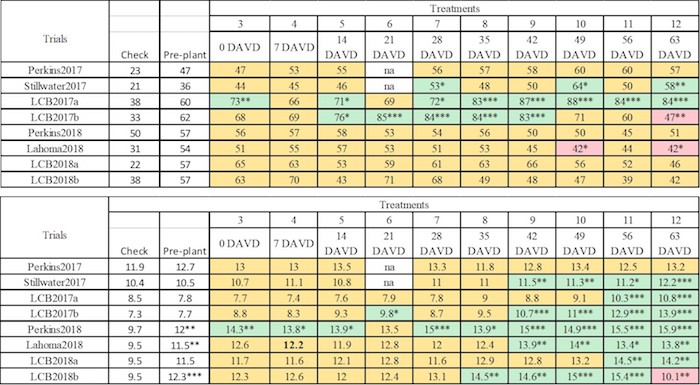
TABLES 2-3 SHOWS THE WINTER WHEAT GRAIN YIELD AND PROTEIN CONCENTRATION, RESPECTIVELY, OF ALL TREATMENTS. THE COLORS OF THE CELLS REPRESENT STATISTICAL DIFFERENCE FROM THE PRE-PLANT TREATMENT. TREATMENTS WITH CELLS SHADED YELLOW ARE EQUAL TO THE PRE-PLANT, GREEN IS STATISTICALLY GREATER THAN WHILE RED IS STATISTICALLY LESS THAN THE PRE-PLANT TREATMENT.
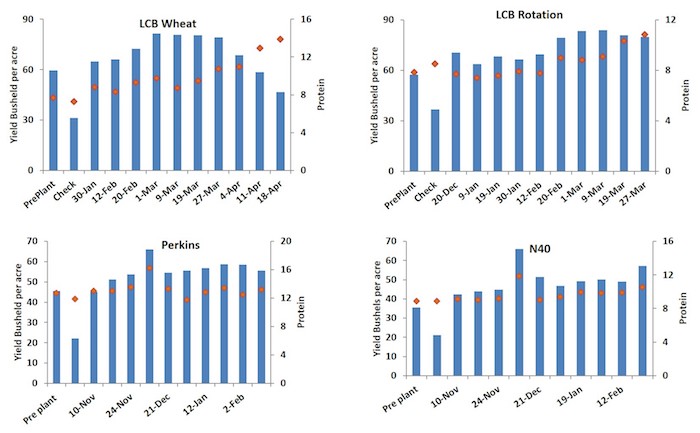
2016-2017 DELAYED NITROGEN WINTER WHEAT GRAIN YIELD AND PROTEIN RESULTS. FOR THE LOCATIONS OF PERKINS AND N40 THE DEC-1 APPLICATION HAS A HIGHER YIELD DUE TO A 2X APPLICATION OF N TO EQUAL 180 LBS.
2017-2018 DELAYED NITROGEN WINTER WHEAT GRAIN YIELD AND PROTEIN RESULTS. THE PERKINS LOCATION IN 18 WAS THE ONLY LOCATION IN THE STUDY WHICH DID NOT HAVE A STATISTICALLY SIGNIFICANT RESPONSE TO ADDED N.
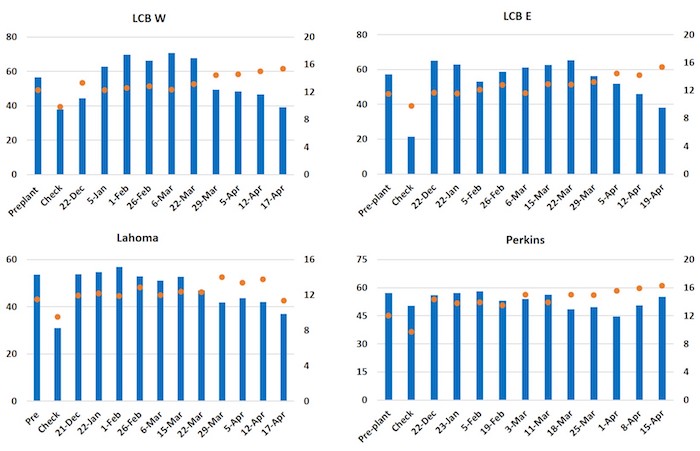
All the data was combined and plotted by cumulative GDD’s>0 from planting (GDDFP) across all locations to determine a general “best” timing. Using the pre-plant application yield as a base there was no yield loss if the applications was made prior to the 143 GDDFP. When the results were normalized by 0DAVD N there was no yield loss if the applications were made prior to 130 GDDFP. The quadratic model created provides the opportunity to identify the point of highest grain yield, which was approximately 94 GDDFP. In terms of the relationship between the application of N based on GDDFP and % of protein content on the grain, a linear response of N delay application observed for grain protein concentration. Our results suggest that the later the application, the higher the protein % in the grains.
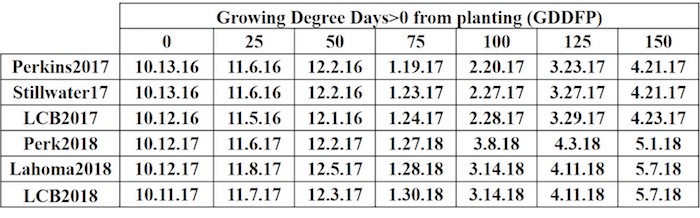
GROWING DEGREE DAYS > 0 FROM PLANTING AND EQUIVALENT CALENDAR DAYS FOR ALL EXPERIMENTAL SITES (LAKE CARL BLACKWELL, PERKINS, LAHOMA, STILLWATER) UTILIZED IN THE STUDY EVALUATING THE IMPACT NITROGEN FERTILIZER TIMING ON WINTER WHEAT, CONDUCTED IN NORTH CENTRAL OKLAHOMA OVER THE 2016-2017 AND 2017-2018 WINTER WHEAT GROWING SEASONS.
We have concurrent work looking at similar approaches with other sources of N such as Urea and UAN. While all of these studies are being continued the past two years of work have presented some easy take homes.
First: Timing of N application does matter, but yellow wheat does not necessarily mean yield loss.
Second: Two years in a row ALL Nitrogen could be delayed until hollow stem without yield Loss, in fact yields of trts with N applied at this time typically better than that of the pre-plant.
Third: Protein content increased as N applications was delayed.
Fourth: The conclusions of this and other studies support that N-Rich Strip concept does not increase risk of lost yield.
Fifth: Applying the majority of the N at or just after hollow stem maximized grain yield and protein with a single shot.
Sixth and Final: Be more concerned about applying N in an environment conducive to increased utilization and less about applying at the first sign of N stress. Take a look at the wheat N uptake curve by K-State.The crop really doesnt get going in terms of N-uptake until jointing i.e. hollow Stem.
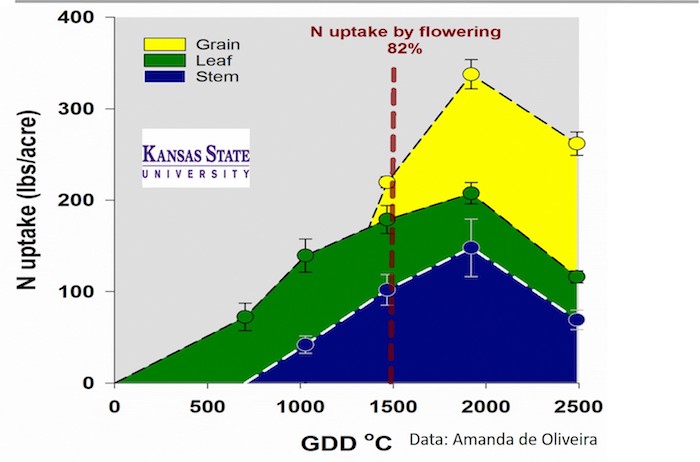
WHEAT N-UPTAKE. FIGURE ADAPTED FROM LOLLATO ET AL.