By Spyridon Mourtzinis, John M. Gaska and Shawn P. Conley
Soybean is the most important oilseed crop in the U.S., and its cultivated area is the second largest after corn.
The cultivated area includes a wide range of environments that extend from northern North Dakota to south Texas and from western South Dakota to northeastern New York (Figure 1).
Soybean maturity is classified in different groups (MGs) ranging from 000 for the very early maturing varieties to 9 for the later. Gradations within MGs are also commonly noted by adding a decimal to the MG number. A variety is classified to a specific MG according to the length of period from planting to maturity.
This phenological attribute is determined by two abiotic factors: photoperiod and temperature (Cober et al., 2001), and these factors can dictate the most suitable MG for a particular geographical location. More than 45 years ago, Scott and Aldrich (1970), delineated optimum MG zones across the U.S.
A more recent study redefined the optimum MG zones using variety trial yield data from 1998-2003 and found that adaptation regions for varieties with MG 0 to MG 3 had not changed from the work done in 1970. Whereas, varieties in the MG 4 to MG 6 range, adaptation zones are much broader than previously thought (Zhang et al., 2007).
Nevertheless, there have been significant changes in soybean germplasm and management practices since 2003, and the climate has changed over the past 80 years across the U.S. (Mourtzinis et al., 2015). Therefore, the objective of this study was to delineate soybean MG adaptation zones across the U.S. using current soybean genetics and climate conditions.
Materials and Methods
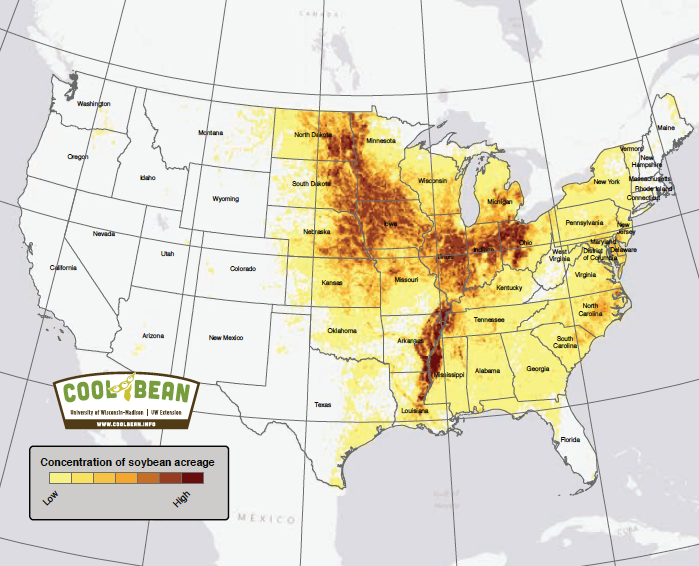
Figure 1. Soybean acreage distribution in the continental U.S. in 2015.
Soybean MG-specific yield data from variety performance trials were aggregated for this study. These trials are typically performed yearly in several locations across each state. For this study, data from 27 states (310 sites) and periods up to 14 years were collected resulting in a database with ~203,500 MG-specific yields (Figure 2). In every trial analyzed, at least 2 to 4 MGs were represented.
The first step of the analysis was to identify the MG with the maximum yield in every location-year-specific trial. Using those results, spatial analysis was performed to predict the optimum MG in unobserved locations.
Finally, the data were extracted, and contour maps of optimum soybean MG zones were developed across the examined region of the conterminous U.S.
Results and Discussion
The map with the optimum MG adaptation zones (Figure 3) shows that MG 0 varieties are best adapted to the region north of latitude 47°N, which covers most of North Dakota, northwestern South Dakota and northern Minnesota.
MG 1 varieties are better adapted to central and north South Dakota, central Minnesota, northern Wisconsin and Michigan, and entire New York whereas, the areas from southern Michigan, Wisconsin, Minnesota and South Dakota extended across northern Iowa and Nebraska are better suited for MG 2 (Figure 4).
Although soybeans are not a major crop in Colorado, MG 2 varieties are better adapted in the northern part of the state whereas MG 3 varieties are better adapted to the rest of the state.
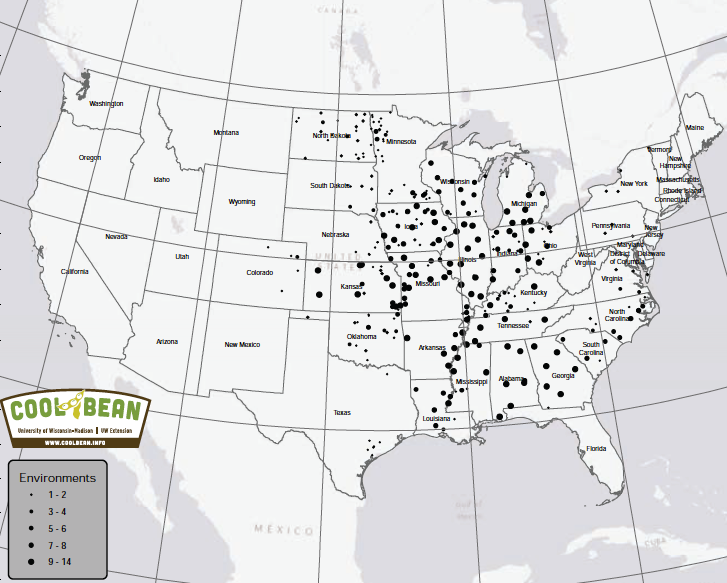
Figure 2. Environments across the continental U.S. in which soybean yield variety trials were performed, and data were used.
The results suggest that MG 3 varieties are adapted to the major soybean producing states, such as the southern half of Nebraska and Iowa, central Illinois, central and northern Indiana, and the entirety of Ohio and Pennsylvania.
Additionally, MG 3 soybeans are better suited to the northern half of Missouri and Kansas. MG 4 varieties are adapted to a wide range of latitudes including the southern half of Kansas, Missouri, Illinois and Indiana as well as the entirety of Oklahoma and Kentucky.
MG 5 varieties seem to be better suited to most of the southern states apart from the southern part of Georgia and South Carolina where MG 6 varieties were better suited.
The results of our analysis are somewhat similar to Zhang et al., (2007) but do not agree with Scott and Aldrich (1970). Nevertheless, this is an older study that used soybean yield data collected before 1970.
Although photoperiod should not have changed, it has been shown that in-season temperatures increased in North Dakota since 1994 (Mourtzinis et al., 2015), which could have allowed for earlier planting of MG 0 varieties.
The later MGs adaptation zones are also different from what was reported from Scott and Aldrich, (1970), who suggested that MG 7and MG 8 are better adapted in southern states.
During the past 30 years, farmers in the south have started to plant earlier in the season, mainly to avoid extreme summer heat and drought stress during reproductive stages (Heitholt et al., 2005). Therefore, MG 5 and MG 6 were identified as the most adapted across the southern states, and these results are in further agreement with Zhang et al. (2007).
In the regions with the largest cultivated area of soybean, multiple soybean variety trials data were available, and the resulting standard errors were small (Figure 3). The data presented can be considered a realistic representation of the optimum MG distribution across the largest and most important soybean agricultural U.S. regions.
It should be noted that the contour lines that extend to western Texas, New Mexico, Wyoming and Montana should be interpreted with caution since they were extrapolated from the examined region.
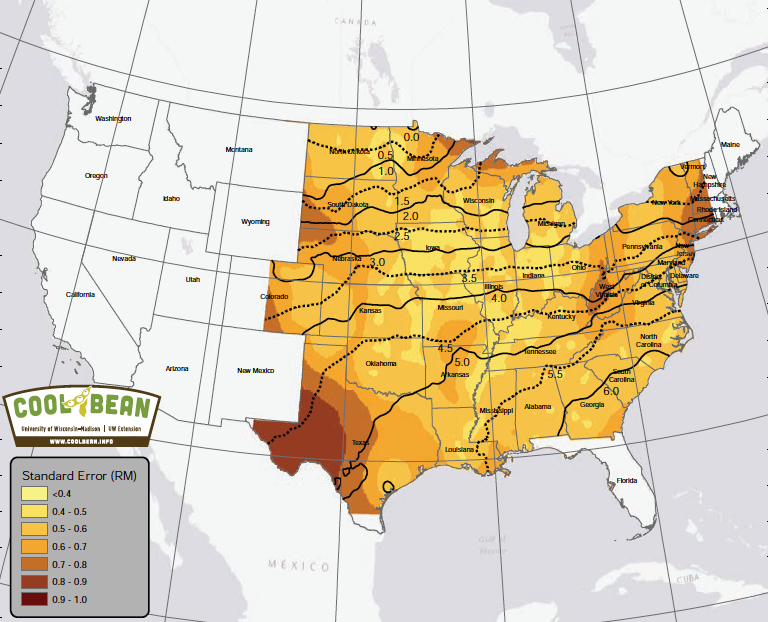
Figure 3. Optimum soybean maturity groups and standard error across the examined region of the continental U.S.
Additionally, during favorable weather conditions and in regions where planting dates can be more flexible, varieties with maturity group designations outside the optimal range can also be grown successfully.
This has been observed in studies conducted at several locations in the southern U.S. where earlier than usual planting dates for the specific locations were tested, and they can use an early soybean production system (Salmeron et al., 2015a; 2015b; 2015c).
Conclusions
The constantly changing weather patterns have led scientists and farmers to change management practices and adapt to the new conditions.
Therefore, the adaptability of new soybean varieties that are a result of genetic improvement needs to be routinely evaluated. The soybean MG adaptation zones developed in this study, when compared to the previous studies conducted 12 and 45 years ago, further highlight the need to be continuously reevaluated and adjusted due to the constantly changing climate and genetics.