Over the last decade there's been a subtle shift across much of the northern soybean growing region towards planting later maturity group soybeans. This shift, either conscious or unconscious, may be attributed to earlier planting dates, relatively favorable fall harvest windows, and the drive for maximum yield as influenced by high commodity prices.
As with all trends, sooner or later we have a correction year — 2014 was that year for many farmers. As farmers, consultants and seed suppliers sort through the plethora of product offerings for 2015, a common question arises: In 2015, how much weight should we really give to maturity group in these seed decisions? The short answer for soybean is not much. Here's why.
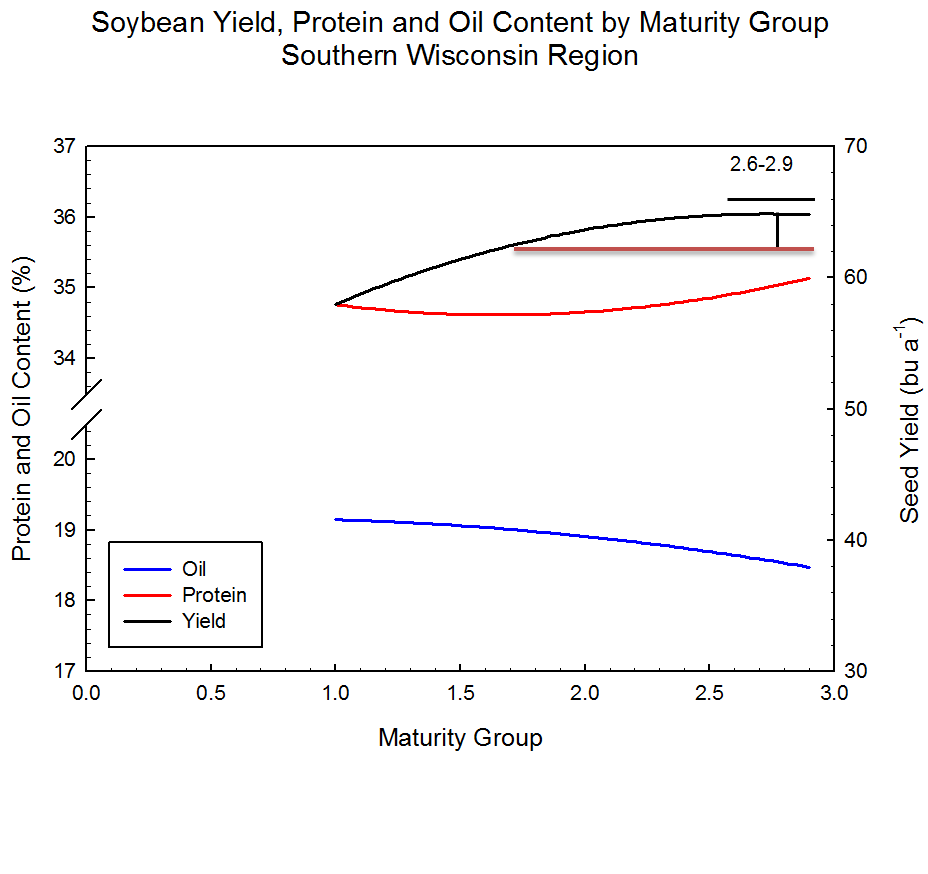
In 2011, the WI Soybean Research Program published an article in the journal Crop Management entitled "Optimal Soybean Maturity Groups for Seed Yield and Quality in WI" (Furseth et al, 2011). In this data set we looked at 893 varieties across 6 growing seasons (2004-2009) and three production regions in Wisconsin. Within each region we identified the optimal maturity group range for maximum yield. Those were 2.6-2.9, 2.1-2.4 and 2.0-2.2 for our southern, central and north central regions, respectively.
Within each figure below there's a maroon line directly below the black yield regression slope. This maroon line indicates the range of maturity groups that lie within 10% of maximum yield. These figures suggest that regardless of growing region in Wisconsin, growers can select a variety that is almost one full maturity group earlier than the optimal maturity group range for maximum yield and still be within 10% of maximum yield.
These data further support Joe Lauer's assertion that "Every hybrid (or in our case cultivar or variety) must stand on its own." In our recently released 2014 WI Soybean Variety Test Results book, the maturity group range that included a starred variety (starred varieties do not differ from the highest yield variety in that test) was 1.9-2.8, 1.1-2.4 and 0.9-2.0 in our southern, central and north central regions, respectively. This amplifies the assertion that the "relative" maturity group rating is trumped by individual cultivar genetic yield potential.

Lastly, let's discuss our "relative" soybean maturity group rating system. If anyone has ever observed a multi-company variety trial in the fall, they may have notice many differences in maturity amongst varieties that have the same MG rating. For example, in our 2014 Southern Region Glyphosate Tolerant Soybean Test we noted a 7-day maturity date range among all the 2.4 maturity group varieties listed. This may not seem important at the end of September, but in years when we plant late (Table 1), having a cool growing season and applying a fungicide those few days may matter.
As seed decisions are made for 2015, it is fine to keep the relative maturity rating on your check list, just don't have it near the top.
Table 1. Calendar date for reaching R5 (beginning seed fill) and R7 (beginning maturity) growth stage (G.S.) by planting date and maturity group (M.G.) for the 2014 growing season at Hancock, Wis.
|
|
|
Timing of G.S. Initiation
|
|
|
Planting Date
|
M.G.
|
R5
|
R7
|
|
5-May
|
1.9
|
29-Jul
|
3-Sep
|
|
|
2.1
|
3-Aug
|
13-Sep
|
|
|
2.1
|
29-Jul
|
3-Sep
|
|
|
2.1
|
29-Jul
|
3-Sep
|
|
|
2.3
|
29-Jul
|
3-Sep
|
|
|
2.3
|
1-Aug
|
6-Sep
|
|
|
2.4
|
3-Aug
|
6-Sep
|
|
|
2.5
|
29-Jul
|
6-Sep
|
|
|
2.5
|
30-Jul
|
6-Sep
|
|
|
2.5
|
31-Jul
|
13-Sep
|
|
22-May
|
1.9
|
12-Aug
|
12-Sep
|
|
|
2.1
|
9-Aug
|
20-Sep
|
|
|
2.1
|
12-Aug
|
16-Sep
|
|
|
2.1
|
12-Aug
|
20-Sep
|
|
|
2.3
|
12-Aug
|
20-Sep
|
|
|
2.3
|
9-Aug
|
20-Sep
|
|
|
2.4
|
12-Aug
|
16-Sep
|
|
|
2.5
|
12-Aug
|
16-Sep
|
|
|
2.5
|
12-Aug
|
20-Sep
|
|
|
2.5
|
12-Aug
|
20-Sep
|
|
11-Jun
|
1.9
|
23-Aug
|
27-Sep
|
|
|
2.1
|
23-Aug
|
2-Oct
|
|
|
2.1
|
23-Aug
|
30-Sep
|
|
|
2.1
|
23-Aug
|
2-Oct
|
|
|
2.3
|
23-Aug
|
2-Oct
|
|
|
2.3
|
23-Aug
|
30-Sep
|
|
|
2.4
|
23-Aug
|
1-Oct
|
|
|
2.5
|
23-Aug
|
2-Oct
|
|
|
2.5
|
23-Aug
|
2-Oct
|
|
|
2.5
|
23-Aug
|
2-Oct
|