Many agriculture producers routinely do some form of on-farm testing in their fields. These tests often consist of side-by-side plots or split-planter variety trials, or they include a non-treated check strip.
But, in order to provide meaningful information from which to make future decisions with confidence, proper consideration at all phases of planning and execution of the trial are important. This article outlines 10 steps to achieve success in on-farm research trials.
1) Ask the Right Question
What do you want to find out? It may seem obvious, but taking time to state your question clearly will help you stay on the right track. Don’t make your question overly complex; try to focus on one practice that you want to compare with your standard practice.
Your question might be: “Does applying a fungicide on corn at V5 increase yield?” or “What is the economic optimum seeding rate for soybeans?” When choosing your question, consider practices that are important to the long-term sustainability and profitability of your farming operation.
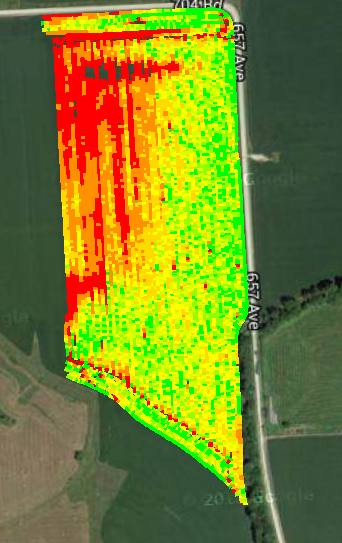 Figure 1: Field productivity variability shown by yield data. Soils with higher clay contents on the west-(left) side of the field had reduced yield.
2) Determine What Data You Need To Collect
Can your question be answered with data you can readily collect? If your question is “Does applying a foliar fungicide on corn at V5 increase yield?” you will need to be able to accurately measure yield with a weigh wagon or a well-calibrated yield monitor. Are there other measurements you could take that would help you better understand your results?
Maybe you would be interested in knowing if the fungicide application increased stalk health. This will require additional measurements and observations prior to harvest, like a stalk “pinch test” or “push test.” You also may be interested in documenting any differences in amount of disease at a particular time in the growing season.
Consider the research question, “Does starter fertilizer result in increased yield?” In this case pre-season soil samples would be beneficial to establish the base fertility of the field. This information will be valuable when trying to make sense of your results.
3) Consider Field History and Variation
Productivity of a field can vary significantly due to soil type, slope, previous crop and fertilizer history, etc. For example, one portion of the field may have more clay and lower elevation, which in a wet year results in reduced yields and drowned out areas (Figure 1). Many producers like to split fields in half; however, this soil-type variability, if not accounted for, can influence the results of your study. Steps 4 and 5 address how to account for this variability.
4) Replicate
Let’s go back to our original question “Does applying a fungicide on corn at V5 increase yield?” To answer this question, we could compare two practices: 1) an untreated check strip and 2) a fungicide-treated strip. Sets of these two treatment strips should be replicated or repeated multiple times throughout the field, usually a minimum of five times.
Replication provides more data across a field, improving your confidence in the yield results. However, replication alone does not minimize field variability – it simply helps you account for it.
Consider the field in Figure 1. If your fungicide treatment is always placed on the east (right) side, and the field is more productive as you move west to east, the results will favor the treatment on the east—the fungicide treatment. If the fungicide-treated area produces higher yields, you will not know if the yield increase is due to soil conditions or the fungicide application. This issue is addressed in step 5, randomization.
5) Randomize
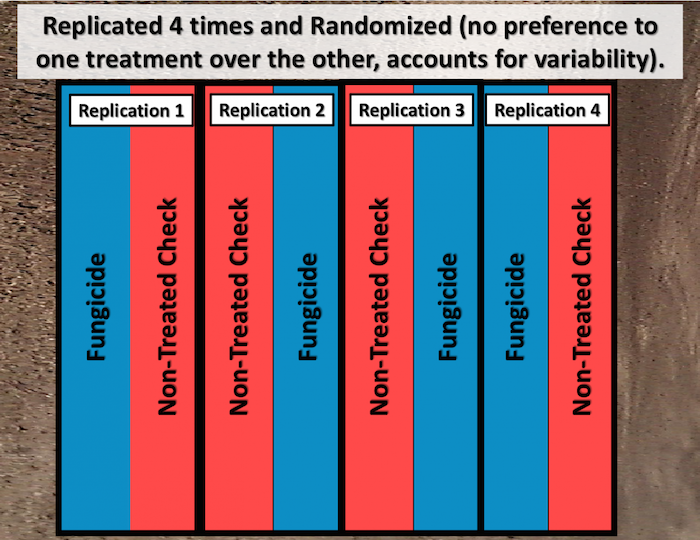
Randomization is used to assign the placement of each treatment within a block to eliminate preference for one treatment over another. The assignment is made randomly, such as by flipping a coin. Figure 2 depicts a properly laid out experiment featuring our two treatments. This diagram has both replication and randomization.
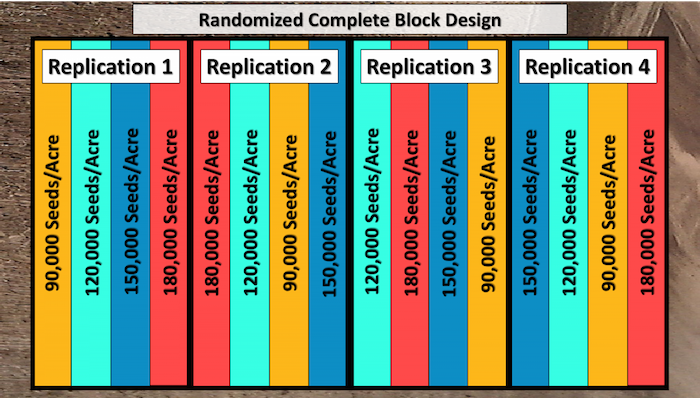
The diagram in Figure 3 shows the same principles for a scenario looking at three or four treatments, in this case soybean seeding rates.
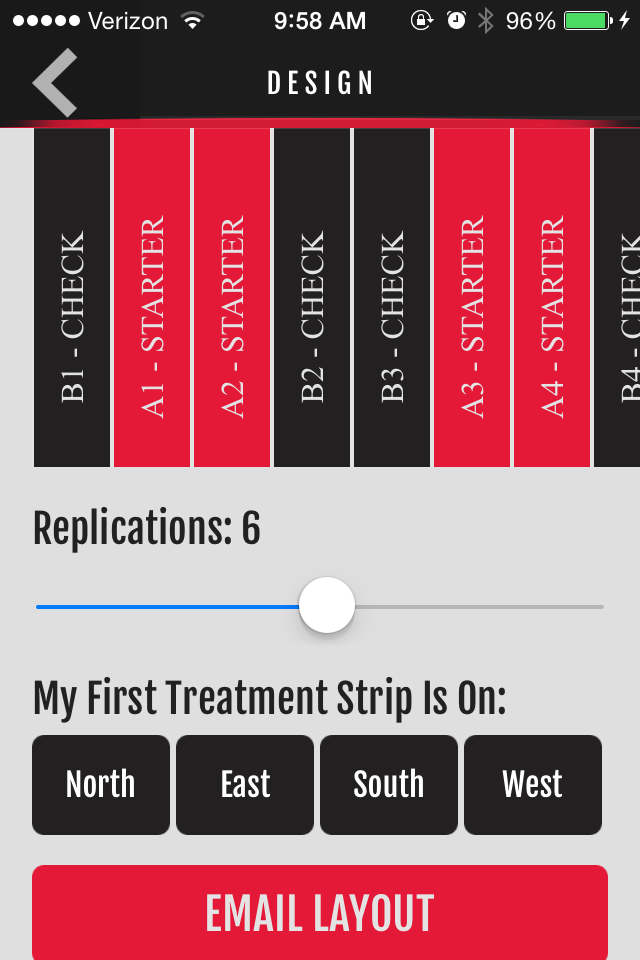 Figure 4: Plot layout generated in the Nebraska On-Farm Research smartphone app.
The Nebraska On-Farm Research Network has developed a free mobile app to help you generate an appropriate plot layout (Figure 4). More information on the app and links to download it can be found at http://cropwatch.unl.edu/farm-research-app1. Additionally, a number of study protocols are a great resource for planning your experiment. These are available at http://cropwatch.unl.edu/farmresearch/protocols.
When a treatment may influence the neighboring treatment—for example with spray drift and mobile nutrient applications such as nitrogen—a buffer is necessary. More information on working with buffers can be found in a section of the Nebraska Extension Grower’s Guide to On-Farm Research.
6) Collect Data
Data collection is a key element of on-farm research. You are probably already collecting a lot of the information you need; however, additional data collection may be beneficial. The following lists information often useful for understanding on-farm research data:
-
Background information: previous crop, planting and harvest date, varieties/hybrids used, seeding rate, plant populations at harvest, chemical applications, soil types, and rainfall/irrigation.
-
Treatment strip locations: flag or log strip boundaries with GPS or document with as-applied data.
-
Observations: additional data may be collected such as stand counts, stalk strength, soil samples, tissue samples, disease/insect/weed pressure, storm damage, and more.
-
Photos: take pictures to help document and remember what you saw. Cell phones often have good cameras which make this easy to do and GPS location of the photo can also be logged.
-
Aerial imagery: This can be obtained in a variety of ways, from satellite to manned or unmanned aircraft.
- Yield: Review your research design prior to harvesting. Yield data can be recorded using a calibrated yield monitor or weigh wagon.
A number of apps allow you to collect and organize records, take pictures, and store GPS locations of your observations. Kansas State University Extension Agronomy’s eUpdate lists some scouting apps to consider.
7) Analyze Results
After gathering harvest data, it’s time to analyze the results. If the trial was set up using replication and randomization as we suggest, statistical tools can be used to determine if there are real differences between the treatments. Using statistics to analyze the data will allow you to have confidence in your results and help you determine if you would get similar results in another field or year. For more information on statistical analysis, see this section of the UNL Grower’s Guide.
Additionally, we at the Nebraska Extension On-Farm Research Network are available to conduct statistical analyses of your results.
8) Use Precision Ag Tools
A number of precision ag tools can make conducting on-farm research very simple. Inputs can be distributed across the field at different rates and as-applied data can be tracked.
At harvest, yield for each strip can be recorded using a yield monitor. It is important to make sure that the yield monitor is accurately calibrated to provide accurate yield estimates. Detailed information on yield monitor calibration is available from Nebraska Extension. Yield monitor data should also be cleaned or filtered to remove errors that occur during data collection. Free USDA software such as Yield Editor is available to help accomplish this.
If yield is recorded using a yield monitor, it is possible to perform additional spatial analysis that can provide valuable information. For example, using computer software you could analyze how optimal seeding rate may vary by soil type within your field. Extension Educators and Specialists working with the Nebraska On-Farm Research Network can also aid in conducting these analyses.
9) Draw Conclusions
Once data has been analyzed, you can draw conclusions and use the results to inform future production practices. With only one year and one location of data, caution should still be used. Your results will be more reliable if you have data from multiple years or locations.
Consider asking a neighbor to do the same comparisons. When making management decisions, consider the economic impact of the research results. Perhaps the fungicide treatment increased yield, but the treatment did not pay for itself.
10) Share and Learn From Others
A great way to increase confidence in your results is to pool your data with others who have conducted similar on-farm research.
The Nebraska On-Farm Research Network provides an opportunity for you to add your data to a larger pool of research and discuss results with others at an annual results update meeting. You can also read about what others tested and learned by viewing Nebraska On-Farm Research results online at:http://cropwatch.unl.edu/farmresearch/resultshome.
When properly executed, on-farm research experiments will allow you to generate your own science-based information that is highly relevant to your farming operation.