
A No-Till Farmer Staff Report
No-tillers are proving to be quite adept at traversing deep waters. Having experienced 5 years of paltry commodity prices, the readers of No-Till Farmer may have turned in their best year financially since corn prices began to dive in the summer of 2014.
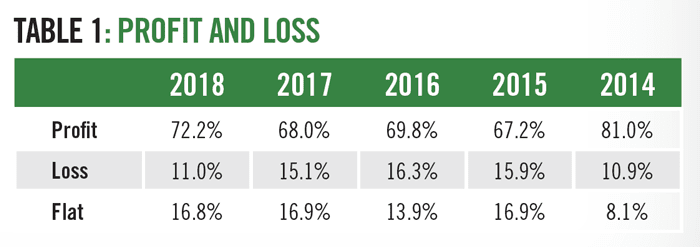
Some 72.2% of No-Till Farmer readers responding to the 11th annual No-Till Operational Benchmark Study said they finished 2018 in a profitable position. (See Table 1.) That was a 4-point improvement over 2017 and the highest number of no-tillers in the black since 2014, when 81% of readers said they were profitable.
On the flip side, just 11% of No-Till Farmer readers said they suffered a loss in 2018. That nearly matched 2014 levels of 10.9% and was the lowest number of farmers experiencing a loss since 2014. The highest percentage of no-tillers in the red was 16.3% in 2016.
No-tillers likely aren’t overly exuberant, but they do appear to be heading into town with a few more dollars in their pockets. As a whole, no-tillers averaged a profit of $58,622 per farm. That was nearly $7,000 more, or 13.4% above, 2017 levels of $51,713 in average profit per farm.
Average no-till corn yields of 181.3 bushels per acre exactly matched no-till corn production numbers for 2017. Based on the January USDA crop production report, the U.S. national average corn yield for 2018 is estimated to be 176.4 bushels per acre, just below the previous record corn yield of 176.6 bushels per acre in 2017.
No-tillers did get a boost from soybean yields despite some quality issues around harvest in more northern climates. Average no-tilled soybean yields of 57.8 bushels per acre beat 2017 soybean yields by a full 3 bushels per acre.
“We think results from this year’s Benchmark Survey show, once again, that tillage really isn’t necessary to raise high-yielding corn or soybeans, and the reduced need for high-priced equipment and fuel with no-till systems simply adds to a better financial picture,” says No-Till Farmer editor, Frank Lessiter.
Farmers are certainly hoping to see a continued rebound in commodity prices to sell some of that bountiful crop. As of the time of this writing, soybeans had moved back above $9.00 per bushel, a 10.5% improvement off the July 9 low of $8.19 per bushel. Corn prices had also improved about 9% off a July 9 low of $3.41 per bushel to $3.72.
Substantial Cuts
After watching expenses in 2017 rise by 7.9% over the prior year and eat into their profitability, no-tillers drew a line in the sand and trimmed expenses nearly across the board. Their average crop operating expenses of $313.88 per acre were $30.85 less than the 2017 average of $344.73 per acre.
Table 2 shows the survey’s national breakdown of crop operating expenses year-over-year since 2014. The average farm size of respondents in 2018 was 1,449 acres, which was well above the 2017 average farm size of 1,147 acres. While total average operating costs per farm of $454,810 is much higher than the 2017 average of $395,407, the final cost-per-acre amount was much lower at $313.88 per acre vs. $344.73 in 2017.
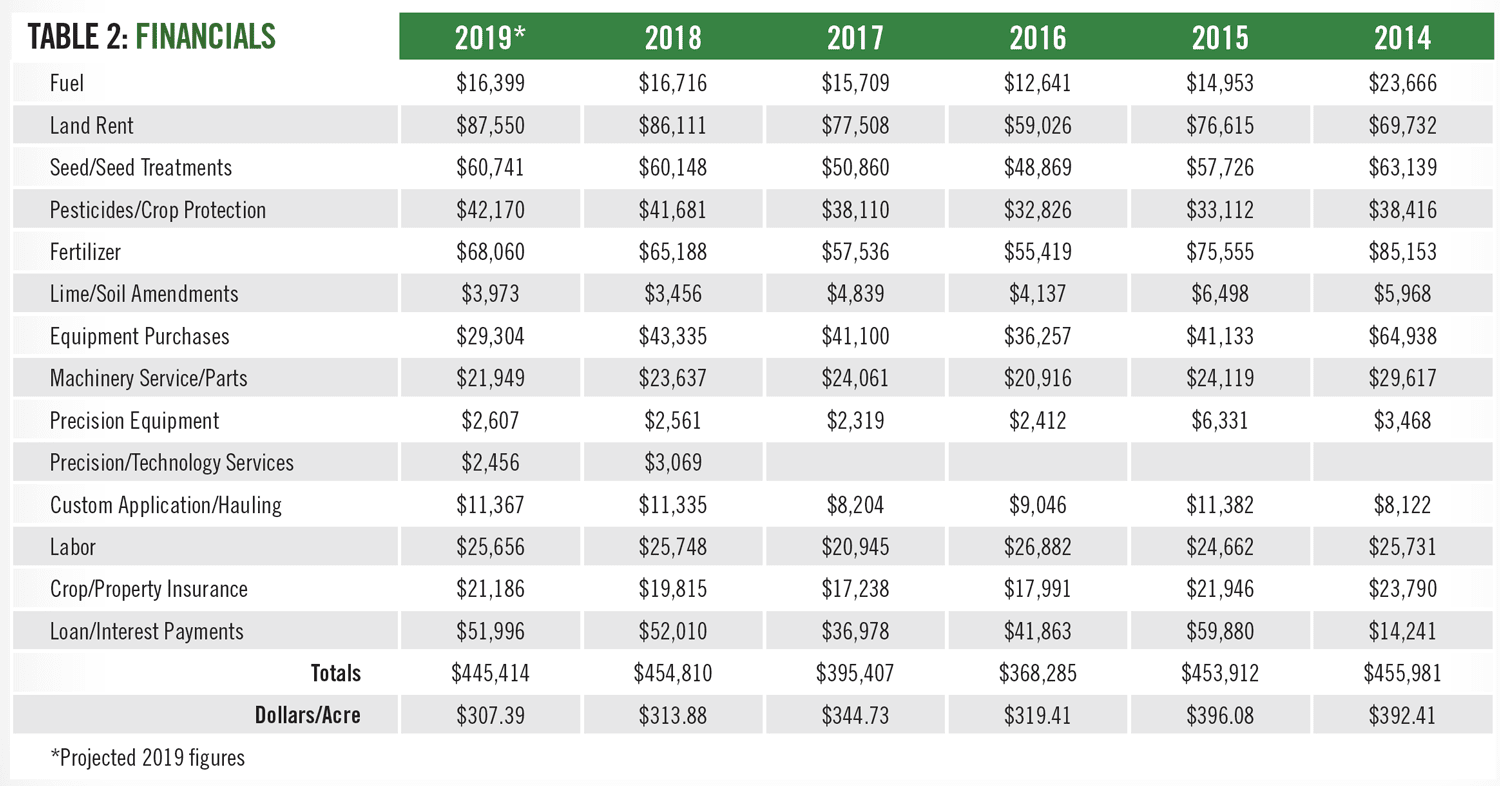
That amounts to a reduction of $30.85 per acre, or a decline in spending of 8.9%. In fact, 2018 spending was an all-time low in the 11-year No-Till Operational Benchmark Study, eclipsing the previous average cost of $319.41 per acre set in 2016.
Here are some noteworthy reductions in costs in 2018 vs. 2017:
• Land Rent: For no-tillers renting farmland, this category tends to be the costliest. Land rent expenses dropped 12% from $67.57 per acre to $59.43, perhaps indicating some landowners are giving their tenants a bit of a break.
• Equipment/Service/Parts: Data from the 2018 study suggests no-tillers reduced their investment in equipment and service/parts. Equipment purchases came in at $29.91 per acre, down 16.5% from the prior year’s spending of $35.83 per acre and even less than the $31.45 per acre they spent in 2016.
Machinery service/parts fell 22.3% from $20.98 per acre to $16.31, which exceeded the previous all-time low of $18.14 per acre in 2016.
• Fuel: No-tillers saved 15.8% by trimming fuel expenses from $13.70 per acre in 2017 to $11.54 in 2018. That was still 0.58 cents higher than the 2016 all-time low levels of $10.96 per acre.
• Fertilizer: Prior to 2014 when commodity prices were vibrant, fertilizer expenses were often the highest expense in a no-tiller’s farm operation. But that’s fallen closer to the level of seed/seed treatments after no-tillers cut applied fertilizer expenses by 10.3%, from $50.16 per acre to $44.99.
• Seed/Seed Treatments: While it has been one category that has grown in cost throughout the 11 years of the benchmark study, expenses for seed and seed treatments actually took a decline by 6.4% from $44.34 per acre to $41.51.
• Crop Protection: A year after seeing pesticide costs jump 16.7%, no-tillers reduced their bill for crop protection by 13.4%, from $33.23 per acre to $28.77 per acre.
Meanwhile, loans/interest payments and custom application/hauling were really the only two categories to see increases. Loans/interest increased 11.3% from $32.24 to $35.89 per acre, and custom application/hauling was up 9.4% from $7.15 per acre to $7.82.
Looking to Trim
While no-tillers anticipate spending more in most categories for 2019, they still believe they will be able to trim their expense position by another $6.49 per acre to $307.39 per acre. That would equate to a 2.1% decrease in overall spending.
Equipment is the expense category no-tillers are targeting, with cuts of 32.4% for purchases and 7.1% for machinery service and parts. However, history has shown farmers often will spend more on equipment and services than what they anticipate earlier in the year.
Other areas where they hope to decrease costs include:
- Fuel from $11.54 an acre to $11.32, or 1.9%
- Precision/technology services from $2.12 per acre to $1.69, or 20.3%
- Labor from $17.77 per acre to $17.71, or 0.3%
Fertilizer appears to be one of the areas where no-tillers are expecting a substantial increase in spending. They anticipate fertilizer to cost $46.97 per acre this year vs. $44.99 per acre in 2018, an increase of 4.4%.
Other anticipated increases include:
- Crop and property insurance at 6.9%, from $13.67 per acre to $14.62.
- Land rent at 1.7%, from $59.43 per acre to $60.42
- Crop protection at 1.1%, from $28.77 per acre to $29.10
- Seed and seed treatments at 1%, from $41.51 per acre to $41.92


Post a comment
Report Abusive Comment