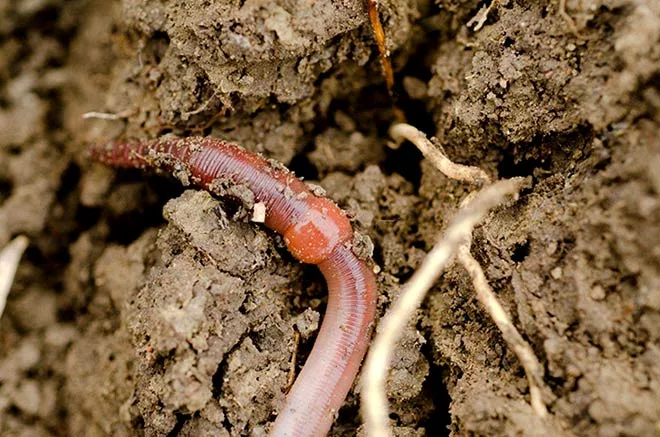
Given the numerous beneficial roles soil biology plays in crop production — including nutrient cycling, water-holding capacity and disease suppression — more no-tillers want to learn how well their soil biology is and what they can do to improve it.

Lance Gunderson admits that it’s “very difficult to measure and evaluate what the ideal soil biology should be or what it currently is.”

But the director of Soil Health & New Test Development at Ward Laboratories in Kearney, Neb., says new tests and other techniques have been developed in recent years to help growers answer those questions. At the 2016 National No-Tillage Conference in Indianapolis, Gunderson presented some of the “soil health” tests that are available, their intended purposes and how to interpret their results.

Phospholipid Fatty Acids

The fatty acids a doctor might tell a patient he or she should be getting more or less of are the same types of fatty acids that can be found in the soil.

Gunderson explains these fats have a lot of carbon that, just like in humans, provide a high source of energy for the microorganisms in the soil.

“When a microorganism dies and the cells break down, those fats are quickly eaten by the other living microorganisms,” he says. “So that’s why we’re able to use phospholipid fatty acids (PLFAs) to help us quantify what’s still alive in the soil.”

Solvita-CO2-Burst-and-Field-Test.jpg

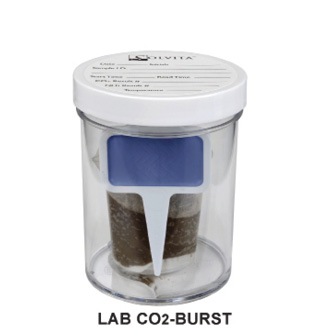
CALCULATING CARBON. The Solvita test is used to measure how much carbon dioxide is generated for a 24-hour period. The more carbon dioxide generated, the more microbial biomass the soil had to start with, says Lance Gunderson.

This test will tell no-tillers how much living microbial biomass is in the soil, the functional group diversity index, the breakdown of organisms in percent of the total biomass, as well as community composition ratios.

How it Works. When a soil sample is pulled for a PLFA test, lab staff will pull the fatty acids out of the soil, which may have 60 or 70 fatty acids present, and look for specific types they’re interested in and assign them to a “functional group,” Gunderson says. The three main functional groups Ward Labs categorizes them by are total bacteria, total fungi and protozoa.

Total bacteria groups explain the condition of the soil, depending on whether bacteria gram positives or gram negatives are present, Gunderson says. In very dry, arid climates, bacteria gram positives tend to dominate the soil habitat, but when the growing season comes along, gram negatives will catch up.

Similarly to any soil test, it’s important to note that the PLFA test is only providing a snapshot of the soil at that specific time, Gunderson says.

“The biology changes faster than some of the other more traditional soil properties farmers are used to measuring, such as organic matter and pH,” he says.

Total fungi functional groups are made up of arbuscular mycorrhizae, which help bring nutrients and water to the plant roots, and saprophytes, which are responsible for breaking down residue.

The last group, protozoans, are what Gunderson calls the predators of the soil.

“They work like grazers. They move around and they’ll actually swim through soil pores that are filled with water and graze on bacteria,” he says.

This grazing, per se, is important because bacteria have a very low carbon-to-nitrogen (C:N) ratio.

“Much like cattle or sheep, protozoans, when they eat these bacteria, have a much higher C:N ratio. They take a little bit of N they need to function, and the rest of it is excreted back into the soil,” Gunderson explains. “So if you have millions and millions of protozoa consuming millions and millions of bacteria over the course of a few weeks, that can add up to quite a bit of N cycling in your system. So that’s why we want to monitor protozoans.”

Aside from the major three, the PLFA test also counts any fatty acids that don’t fall under one of those categories and is considered “undifferentiated.” Unfortunately, the majority of fatty acids fall under this category.

Total Biomass Diversity Rating
> 4,000 > 1.6 Excellent
3,500 - 4,000 1.5 - 1.6 Very Good
3,000 - 3,500 1.4 - 1.5 Good
2,500 - 3,000 1.3 - 1.4 Slightly Above Average
1,500 - 2,000 1.2 - 1.3 Average
1,000 - 1,500 1.1 - 1.2 Slightly Below Average
500 - 1,000 1.0 - 1.1 Poor
< 500 < 1.0 Very Poor
PLFA BASELINE. Lance Gunderson says there’s no standard ranking for the Phospholipid Fatty Acids (PLFA) test, but the Soil Health & New Test Development director at Ward Laboratories in Kearney, Neb., developed this table of rankings based on samples he’s seen from across the U.S.

“Ninety percent of what is growing or what lives in the soil, from a microorganism standpoint, we can’t actually categorize into any one group,” Gunderson says. “It’s all so new to science. This is just one of the drawbacks to this type of test.”

The Results. Gunderson admits that trying to interpret the results of a PLFA test can be overwhelming. But generally the higher the biomass and biological diversity, the better off the soil is.

But he notes that those aren’t dependent on each other.

“We can have a soil with relatively high biomass and very poor diversity,” he says. “And I’ve seen soils with the opposite. Overall, we want to shoot for something in the middle. We’d like to see soils that exhibit a relatively high microbial biomass, but also have enough diversity that we’re filling some of those functional roles that we want to see take place.”

Unfortunately, there’s no standard ranking for PLFA results, as Gunderson says the test hasn’t been around long enough to establish what a grower’s numbers should be based on their soil, rotation and climate. The best solution he’s come up with so far is a table of rankings based on samples he’s run from states spanning much of the U.S. (See Table 1.)

Solvita Test

The purpose of the Solvita 24-hour Burst test is to measure how much carbon dioxide is generated for a 24-hour period.

“The idea there is that the more carbon dioxide is generated, the more microbial biomass you had to start with,” Gunderson explains.

He clarifies that while the term microbial activity is often used, it’s not synonymous for microbial biomass.

“Really what this represents is biomass with the potential for activity,” he says. “So when the conditions are right and the soil temperatures are good and the moisture’s good, we’ll start to see a change in the activity.”

He adds that microbial biomass is also related to soil fertility, its texture and structure, and the organic matter compound.

How it Works. There are two types of Solvita tests — one that is conducted in the lab and another that growers can use in the field. In his presentation, Gunderson discussed the lab test, noting that while both tests are very similar, a grower would interpret the results differently.

In the lab, Gunderson says they dry the soil sample out, grind it and add it to a jar. They then wet the soil and incubate it for 24 hours, with a carbon-dioxide paddle present. The paddle starts off as a dark blue color, but the more carbon dioxide is generated, the brighter yellow the paddle becomes.

The Results. The test results can range anywhere from 0 parts per million (ppm) carbon dioxide up to 450 ppm.

While no-tillers may think the higher the better, Gunderson says the ideal score for a grower will depend on their goals.

“If your goal is to armor the soil and keep residue on the soil surface, and you have a Solvita score of 200 and your residue is turning over very quickly, you’re not really achieving your goal,” he explains. “So in that case, driving your Solvita score higher results in more microbes, which are just going to eat more.”

Ideally, he says he likes to see the score around 150 for most soils. But on sandy soils or in areas with an arid climate, it’s not realistic to shoot for that high of a score.

“The test is going to be somewhat limited based on region, which is further based on soil types and climate,” he explains. “We have to make realistic goals and work within the confines of the region we are working in. However, the important part for no-tillers is that management can have profound effects within a region.”

Haney Test

Incorporating the Solvita test into his own, USDA Agricultural Research Service soil scientist Richard Haney developed a package of soil health tests to create the “Haney test.”

Soil Condition & Soil Care Based on the Haney-Brinton Respiration Test
Test Result ppm CO2-C N-Mineralization Potential Biomass
> 100 High N potential soil. May provide sufficient N for entire crop. Soil is well supplied with organic matter. Biomass is greater than 2,500 ppm.
61 - 100 Moderately high. This soil has limited need for supplemental N. Ideal state of biological activity and adequate organic matter level.
31 - 60 Moderate level. Supplemental N is most likely indicated. Requires new applications of stable organic matter. Biomass is 1,000 ppm.
6 - 30 Moderately low. Will not provide sufficient N for most crops. Low in organic structure and microbial activity.
0 -5 Little biological activity; requires significant fertilization. Biomass is less than 100 ppm. Put into intensive green manure or other long-term cover crops.
GOAL SETTING. A higher Solvita score doesn’t always mean it’s better. Lance Gunderson says no-tillers need to determine what the best score for them would be based on their goals, but he likes to see most soils around 150.

Gunderson says Haney designed this test to help answer three main questions: What condition is your soil in? Is your soil balanced? What can you do to help it?

How it Works. One soil aspect the Haney tests looks at is fertility. Using an extract Haney and his colleagues developed called H3A, they measure plant-available nitrate and ammonium, phosphate, potassium, calcium, iron and aluminum.

The other extract is water. Gunderson explains that a majority of microorganisms live in tight little groups on soil particles and organic matter particles, and the only way they can access nutrients is when the nutrients are passing by in water.

As nutrients move with water through the soil profile, they take advantage of those situations. It’s why N mineralization and residue breakdown don’t occur when it’s too dry.

By using water as an extract, the test can measure some things growers wouldn’t normally see on soil tests, including organic carbon and organic N.

The test looks at water extractable organic carbon (WEOC) because it reflects the quality of the organic carbon, which feeds the soil microbes.

Gunderson says to think of soil organic matter (SOM) as the house the microbes live in. A soil with 4% SOM can house more microbes than a soil with 2% SOM.

But the water-soluble organic carbon is the refrigerator.

“Microorganisms are going to eat,” he says. “And if we don’t have an easily accessible form of carbon out there, they’ll eat the house to survive.”

He notes that he’s seen soils with 6% SOM only have 100-200 ppm WEOC, while sandy soils with 1.5% SOM may have 500 or 600 ppm WEOC, depending on the management plan a grower is following.

Microbes also need water extractable organic N (WEON).

Gunderson says some of the WEON comes from the SOM itself, but a lot of it comes from cover crops, residue and manure.

He notes that while WEON will move, it doesn’t move as quickly as nitrate and ammonium.

“Microbes want to keep this around,” he explains. “They’ll keep it circulating in the soil system. So organic N really acts like a safety deposit box for your soil N, and then the microorganisms are the key; they have the combination to get it back out.”

But getting that N available again depends partly on the C:N ratio. If there’s a ratio of 20:1, N is limited at that point, causing the microbes to hold onto it longer.

“Bacteria have a C:N ratio of about 3:1. They’re little bags of N fertilizer. When they consume a food source with N in it, they’ll temporarily tie it up before cycling it back into the soil, part of which is plant-available N,” Gunderson says. “They rely on N much more than you and I, and much more than the crop.

“The idea here is we want to balance that ratio, we want to get it somewhere between 8:1 and 15:1, in order to increase N cycling to allow the microbes to help feed the crop. Stable SOM has a C:N ratio of 10:1 to 12:1, so that would be absolutely perfect.”

The Results. The Haney test gives a soil health score and the ideal score they like to see is above 7, but Gunderson admits that’s a bit arbitrary.

“That doesn’t mean if you score below 7 you’re doing something wrong,” he says. “It doesn’t mean if you score above 7 you’ve got all the answers. Seven is just a place to start.”

Gunderson recommends looking at the soil health score first and then working your way through the test results to determine how you got that score.

“Say you got a score of 15. You’re doing pretty well. Why? What individual components are you excelling at? Which ones maybe need a little more help? Or if you’ve got a score of 4, where are you struggling?”

The first recommendation Gunderson offers to no-tillers analyzing the results is to focus on balancing the C:N ratio first, “in order to make the engine run.

“It doesn’t matter how fast you think the car can go if you can never get it started.”

The test also provides a general recommendation for cover crops, which just says what percent of grass species there should be to legumes. The recommendation is based on both the soil health score and the C:N ratio.

For example, if a grower has a C:N ratio above 20, they’re going to focus on adding legumes to the mix to help bring that ratio down, regardless of what the soil health score is. But if a grower has a C:N ratio of 12:1, and their soil health score is 20, Gunderson says the reason the soil health score is high is likely due to a high Solvita test. And if a grower has a high Solvita score, then he has a lot of microbes to feed and that means he’ll want to put more grasses in the mix.

The test also provides some fertilizer recommendations and may help growers save more on their N inputs than traditional soil tests.

The Haney test provides the traditional evaluation in pounds per acre, which are nitrates only. But it also provides the nitrate and ammonium available in the topsoil, plus the organic release.

In the example Gunderson shared at the conference, the soil had 14 pounds per acre of nitrates, but with the organic release and ammonium included, the Haney test credited it for a total of 38 pounds per acre. If a grower were to follow the Haney test, he could put on 20 pounds per acre less N than he would if he were just using the traditional N test.

The best way to work with the Haney test is to start building up some ranges and comparisons, either on your own farms or with other growers, Gunderson says.

“Find what you consider to be the absolute poorest soil,” he says. “And then find whatever you define to be the best. If you run a sample from both, that should give a bit of a low range and a top range.”

He adds that for growers looking to use it as a soil health measurement, it doesn’t matter what time of year a grower takes the test, as long as he’s consistent in his sampling timing in subsequent years.

“The values do change based on soil conditions and time of year, so we need to be consistent,” he says. “I would say now that fall is typically the best time for most agronomic situations, but any time will work.


CTG February 2017 Contents