Phosphorus (P) is an essential plant nutrient and P fertilizers are added to supplement the soil's available P. There are economic and environmental benefits to making informed decisions about P fertilizer use. The under-application of P fertilizer can result in reduced yields, while over-application adds to input costs, with economic losses resulting from both scenarios. From an environmental perspective, excessive P going into streams and lakes can result in toxic algal blooms.
A few frequent questions about P fertilizer use are: Does P fertilizer always result in a positive yield response? How much yield increase is expected with applied P? What is the likelihood of yield penalty if P fertilizer is not applied?
A recently published factsheet, Soil Phosphorus and Crop Response to Phosphorus Fertilizer in Ohio, provides a general overview of soil P and highlights the findings of Culman et al. (2023) to answer these practical questions (Rakkar and LaBarge, 2024). The study summarized 457 replicated field P trials conducted over the last 45 years across 40 counties in Ohio. The robust dataset evaluated corn, soybean, and wheat response to added P fertilizer in trials conducted on farms and at research stations.
Below are some key takeaways:
Does P fertilizer always result in a positive yield response?
No. Out of the 457 field P trials, a significant increase in crop yield was observed in 107 trials with P application. The crop response to added P also varied among crop types. Corn responded to P application in 29.9% of trials, soybean in 14.2%, and wheat in 36.8% (Fig. 1).
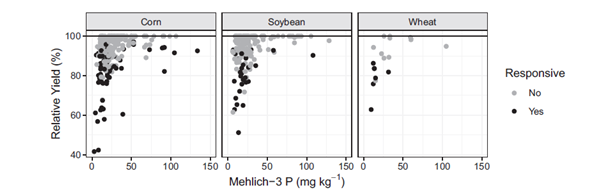
Fig. 1. Relation of relative yield and soil Mehlich-3 P for corn, soybean, and wheat across 457 field trials (Culman et al., 2023).
How much yield increase is expected with applied P?
It depends on the Mehlich-3 soil test P level. The Mehlich-3 soil P measures the readily available soil P for crop uptake. Culman et al. (2023) classified Mehlich-3 soil P levels into five categories: <10, 10–20, 20–30, 30–40, and >40 ppm to evaluate the yield increase for each soil P category.
The crop yields were presented as Relative Yield, which refers to the yield with no P application divided by the maximum yield obtained across all P treatments. In other words, 100% relative yield means no yield increment with added P. The lower the relative yield, the higher the yield increment.
Generally, as the soil test P levels decreased, the yield increment increased with P input (Table 1). When the soil test P was less than 10 ppm, the median relative yield was 87%. As the soil test P level increased above the critical level of 20 ppm, the median relative yield ranged from 97% to 99%, signifying minimal yield increment with added P.
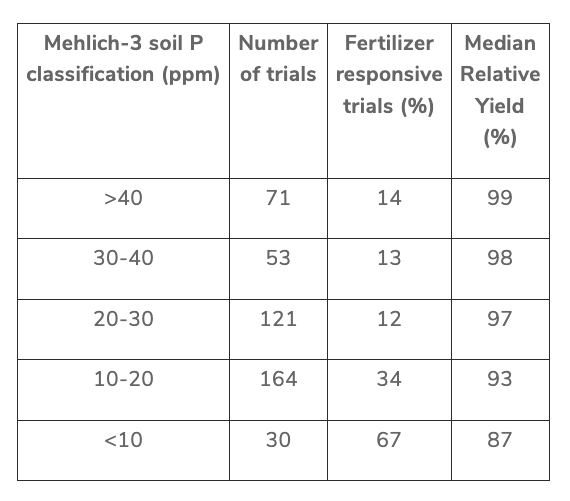
Table 1. Summary of crop response to P fertilizer by soil P classification. (adapted from Culman et al., 2023)
What is the likelihood of yield penalty if P fertilizer is not applied?
We can also determine the likelihood of yield penalty based on Mehlich-3 soil P with the information in Table 1. When the soil P level was less than 10 ppm, 67% of trials showed increased crop yields with applied P. When the P levels were above the critical level of 20 ppm, only 12-14% of trials showed increased crop yields. In other words, the likelihood of yield penalty with no P application decreases as soil P levels go above 20 ppm. If the soil test P level is less than 20 ppm, there is an increased risk of yield penalty with no P application.
For more soil fertility resources, information, and tools, go to go.osu.edu/fertilityresources.