While 2020 will be remembered for its many dramas — including a global pandemic, civil unrest, a historic derecho, uncertainties in the commodities markets and a highly contested presidential election — no-tillers actually seem to have fared relatively well.
According to the results of the 13th annual No-Till Farmer Operational Benchmark Study, 89.6% of no-tillers reported a profit in 2020, up from 81% in 2019. This brought those who reported a loss down to 10.4%, which is the lowest percentage to report a loss since 2014, when 10.9% said they ended the year in the red.
The 2020 average net income of $61,851 was nearly 29% higher than 2019’s average income of $48,063 — the highest net income has been since 2014 when that totaled $73,011. The improved financial picture should be viewed with some context, however, as it may have more to do with governmental payments related to the COVID-19 pandemic than beneficial market conditions.
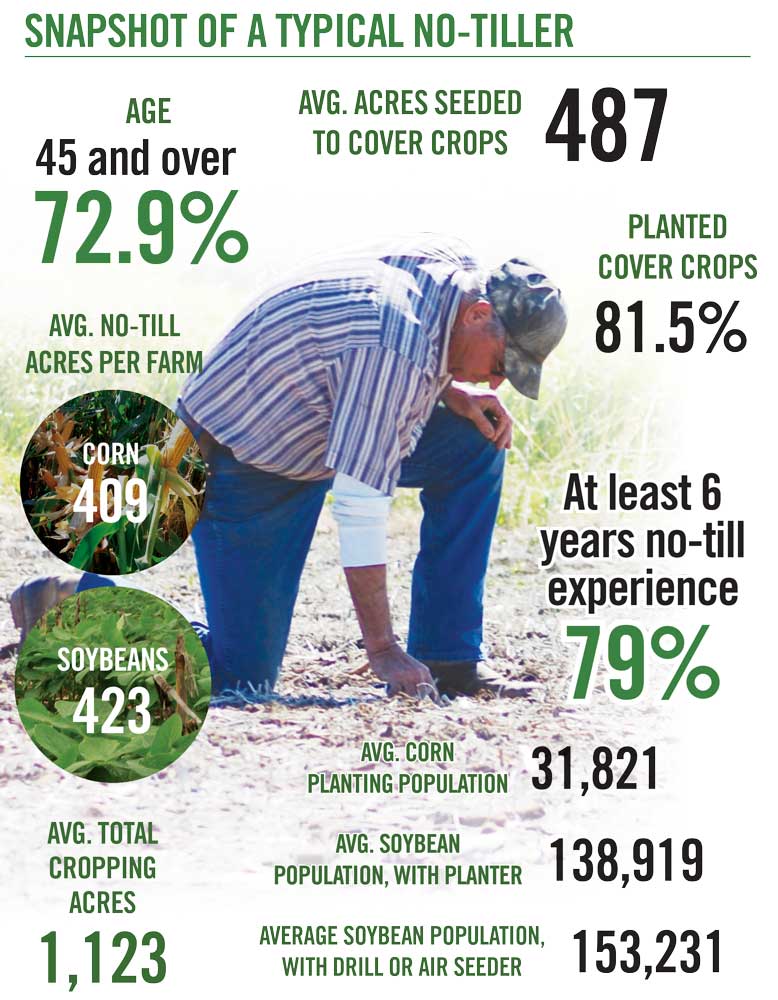
More than 600 U.S. growers — with average cropping acreage of 1,123 — responded to No-Till Farmer’s exclusive survey of no-till practices. Mixed practices are common, with 94.1% practicing no-till, while 16.6% use strip-till, 22% practice vertical tillage and 19.2% use minimum-till. Minimum-till in particular has fallen sharply since 2016 when 30% of respondents were engaging in this practice.
In 2020, expenses increased about 1% over 2019, going up by $4,327 from an average of $438,652 to $442,979. On a per-acre basis, that equates to an average of $394.46 for 2020 as opposed to $405.18 in 2019.
Many expense categories showed a decrease, but notably, expenditures on equipment went up to $53,409, an increase of $6,723 over 2019’s $46,686. Precision equipment went up by 150%, jumping from $1,636 in 2019 to $4,106 in 2020. Not surprisingly, growers say they expect those expenses to fall again in 2021, anticipating equipment purchases of about $36,408 and precision equipment expenditures of just about $2,500.
Interestingly, in the 2020 survey, respondents had said they expected to spend considerably less — about $34,000 — on equipment and precision equipment for 2020, suggesting that they may have taken advantage of the positive economics of the year to make some unplanned purchases.
Here’s how growers broke down other operating expenses in 2020 and what they anticipate spending in 2021.
Fuel: Reflecting lower fuel prices across the country, on-farm fuel expenses took a slight dip in 2020, coming in at $12,417 compared to $13,356 in 2019, a 7% decline. Growers say they aren’t expecting to see an increase in fuel costs for 2021, but it should be noted that the surveys were completed before the new presidential administration took office.
Land rent: While still one of the highest expenses, land rental payments hit a 5-year low in 2020. Averaging $66,651, this category came in more than $4,000 less than 2019’s $70,984 and almost $20,000 less than the $86,111 that was reported in 2018 — but not quite as low as 2016’s $59,026. Growers are not anticipating a large increase for 2021, which is expected to come in at $67,531.
Seed/seed treatments: Growers saw about a 9% increase in seed and seed treatment costs from $42,146 in 2019 to $45,921 in 2020. This does not include the $6,916 they spent on cover crop seed in 2020, a figure No-Till Farmer did not report on in 2019. For 2021, they’re expecting to pay about the same for cash crop seeds but anticipate spending about 8% more for cover crop seed.
Pesticides/crop protection: The average grower cut pesticide and crop protection expenses by about $1,000 in 2020. At $35,028, this was the lowest total for this category since 2016’s $32,826. Growers are anticipating spending a little less in 2021 — $34,376.
Fertilizer: Growers were anticipating a big drop in fertilizer costs for 2020, expecting to pay out about $56,000 after they had spent just over $67,000 for these products in 2019, which would have been a 16% decrease. However, this didn’t happen and growers spent about $62,000 on fertilizers in 2020 — which is still a respectable 7% decline. For 2021, they’re expecting expenses to go up slightly to $63,796.
Machinery service/parts: In 2020, machinery service and parts average $22,740, down just slightly from 2019’s $23,301. For 2021, however, growers are expecting a larger decline, budgeting an average of $19,726, perhaps because they’ve spent money on newer equipment and are therefore expecting they won’t have the same upkeep expenses.
Precision/tech services: While growers anticipated spending only $1,400 on precision services in 2020, those expenses actually averaged about $2,600. While not a large amount in absolute terms, the actual expense was an 85% increase over what was expected. For 2021, budgets are perhaps looking more realistic at about $2,500.
Labor: After going up dramatically from $25,748 in 2018 to $44,521 in 2019, labor expenses came back down about halfway in 2020 to about $33,000. For 2021, labor costs are expected to be similar to 2020.
Loan payments/interest: Growers anticipated a big jump in this category for 2020 and indeed, they got one. Coming in at almost $67,000, 2020’s loan payments and interest was almost $8,500 — or almost 15% — higher than 2019’s expense.
Cropping Choices
Total cropping acres increased slightly to 1,123 in 2020 from 1,082 in 2019, and the number of acres that were planted to no-till corn, soybeans and small grains all went up modestly.
No-till small grains climbed to an average of 311 acres, up from 249 in 2018 and the largest number since 330 acres were planted to small grains in 2016. In addition, a greater percentage of no-tillers report growing small grains — 55.3% in 2020 compared to 52.3% in 2019 — perhaps in an effort to increase rotational diversity.
Soybean acreage increased to 423 acres in 2020, up from 402 in 2019, but far from the average of 501 soybean acres in 2018. The most common row spacing for soybeans was 15 inches in 2020, at 49.1%. This is up from 40.8% in 2019 but down from a high of 57.4% in 2016. Thiry-inch rows regained in popularity in 2020, coming in at 43.3% compared to 21.8% in 2019, but almost even with the 42.4% reported in 2015.
Corn acreage was up slightly to 409 acres from 403 in 2019, but quite a ways off from the high of 455 seen in 2018. At 91%, the most common row spacing for corn was 30 inches. This has remained quite consistent for years. Corn growers who report raising corn in 15-inch rows, however, has dropped considerably from a high of 9.9% in 2017 to only 1.3% in 2013.
Yield Variance
Despite planting and growing conditions that were widely reported as favorable in 2020, corn yields decreased slightly to 173 bushels per acre compared to 2019’s 175 bushels per acre. This is the lowest no-till corn yield average since 2016, when it was just below 171 bushels per acre.

MIXED RESULTS. In 2020, no-till corn yields came down slightly from 2019, which was down from 2018. No-till soybean yields rebounded a bit, however, and wheat yields stayed steady.
After declining to 53 bushels per acre in 2019 from a high of 58 bushels per acre in 2018, no-till soybean yields just about split the difference in 2020 at 55 bushels per acre.
The 2020 average yield for winter wheat — 68 bushels per acre — was almost identical to 2019’s average of 68 bushels per acre but didn’t approach the high of 77 bushels per acre seen in 2017.
Among the yield data that was evaluated for different tillage systems, strip-till produced the highest corn and soybean averages again in 2020. Those who identified themselves as strip-tillers averaged 194 bushels per acre for corn and 58 bushels per acre for soybeans, almost identical to averages reported in 2019 (194 and 59, respectively).
Those who practice vertical-till reported corn yields averaging 178 bushels per acre and soybean yields averaging 56 bushels per acre. Farmers practicing min-till average 187 bushels per acre of corn and 53 bushels per acre of soybeans.
Equipment and Technology
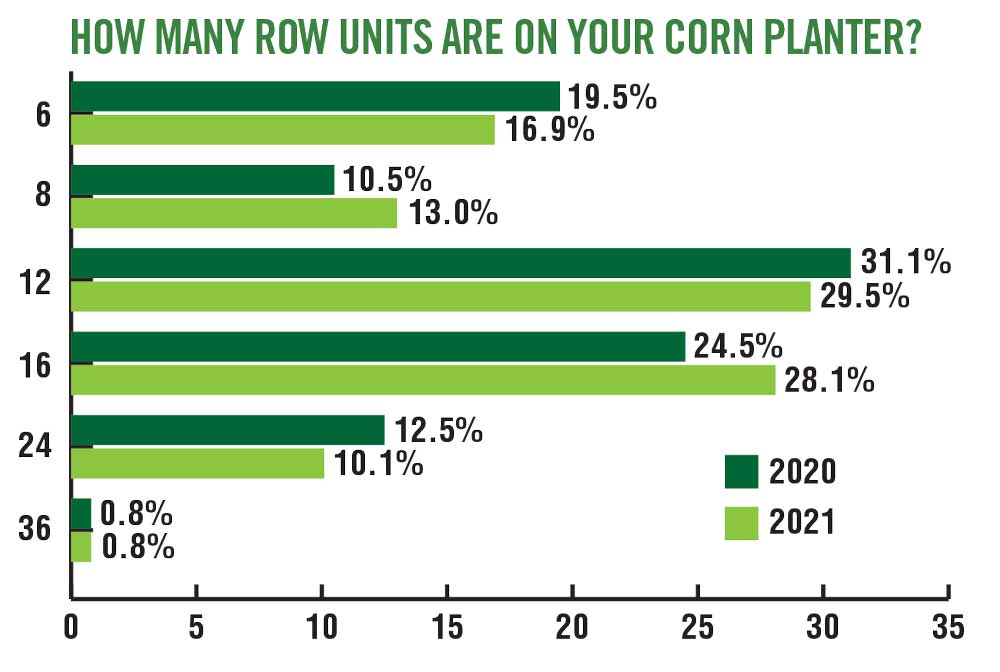
While many of year-over-year changes in equipment are minor, looking at 5-year trends reveals that certain planter attachments show increasing adoption.
In 2020, 88% of no-tillers said they have closing wheels on their planter, up from 83% in 2016. Pop-up applicators are up from 40% in 2016 to 45% in 2020. Down-pressure systems increased from 41% in 2016 to 49% in 2020.
Seed metering systems are also being more widely adopted, having increased from 30.6% in 2017 (the first year for which we collected data on this item) to 40.1% in 2020.
Only 43.8% of no-tillers said they had coulters on their planters in 2020. This isn’t a huge decline from 2016’s 51.1%, but when you consider a survey done by No-Till Farmer in the 1990s that reported a whopping 94% of no-tillers using coulters at the time, the long-term trend is clear.
Heading into 2021, no-tillers are planning to make some large equipment purchases as well. Drills are growing in popularity, and 5.5% of respondents said they are looking to purchase one in 2021 — up from 4.3% in 2020.
More no-tillers are also looking at air seeders, with 4.3% of no-tillers eyeing them for 2021, up from the 2.3% of respondents who planned to buy one in 2020. Self-propelled sprayers have seen an even larger increase, with 4% of growers planning a purchase in 2021 compared to 1.6% in 2020.
Interest in precision technology waxes and wanes somewhat but use of variable-rate seeding and fertilizing both showed a decline from 2019 to 2020.
Variable-rate seeding was used on just 23.6% of farms in 2020, compared to 32.2% in 2019. Farmers are anticipating a slight up-tick in use, however, with 24.4% saying they’ll utilize the technology in 2021. Variable-rate fertilizer dropped from 45.1% in 2019 to 35.1% in 2020 and there is a further decline to 32.5% expected in 2021.
Covering Up
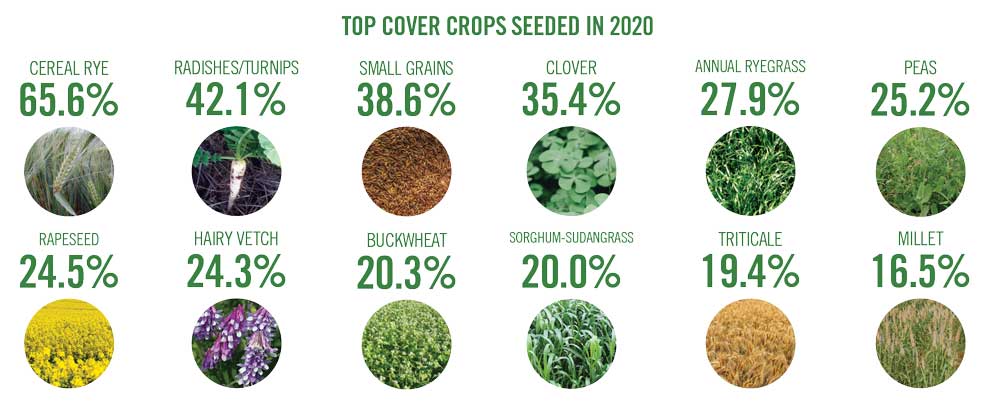
No-tillers are ahead of the curve when it comes to adopting cover crops. According to the 2017 Census of Agriculture, the average number of cover crops per farm was just 100 in 2017. In our survey of no-tillers, the average cover crop acreage in 2020 was 487, up slightly from 2018’s 471.
In 2020, 61.2% used multi-species cover crops mixes, down from 70% in 2019 and the lowest since 60.7% in 2017.
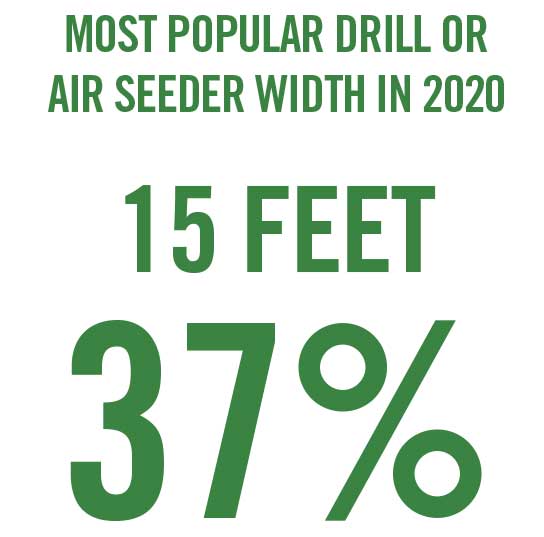
Using a drill was the most common way to seed cover crops, at 59.7% in 2020, followed by using a spreader (34.8%), aerial seeding (20.3%), and using an air seeder (17.8%), an interseeding device (5.7%), a high boy (5.7%) and a planter (5.4%).
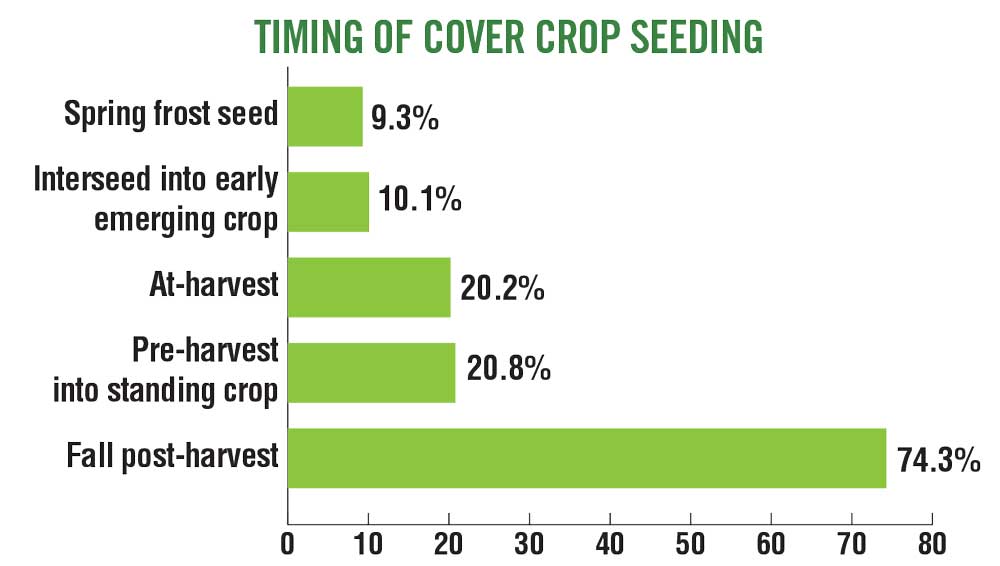
Seeding cover crops after fall harvest was the most common timing, with 74% of respondents seeding at that time. Seeding pre-harvest into a living crop and seeding at harvest were both practiced by about 20% of respondents.
A growing percentage (10.1% in 2020 compared to 9% in 2019) of no-tillers are attempting to interseed cover crops into an early emerging crop, and spring frost seeding declined 1 percentage point in 2020 to 9.3%.
Livestock Integration
With a growing interest in regenerative agriculture, it’s perhaps no surprise that more farmers are integrating livestock into their operations.
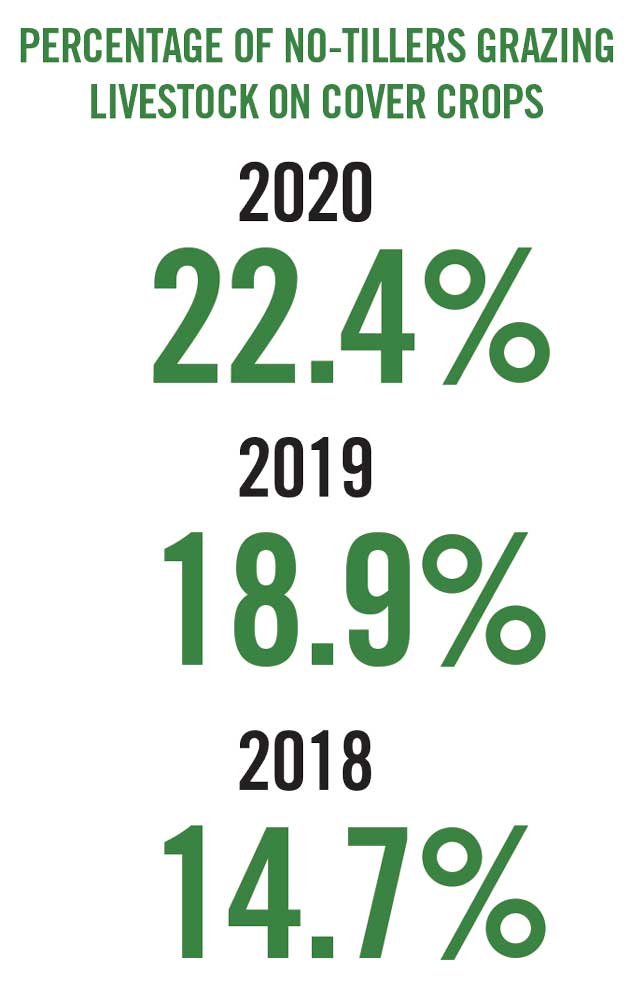
The percentage of farmers who own beef cattle (37.5%), swine (10%) and poultry (7.7%) are each up about 4 percentage points. Of those who have livestock, 22.4% reported grazing them on cover crops in 2020, up from 19% in 2019.
Pesticide Inputs
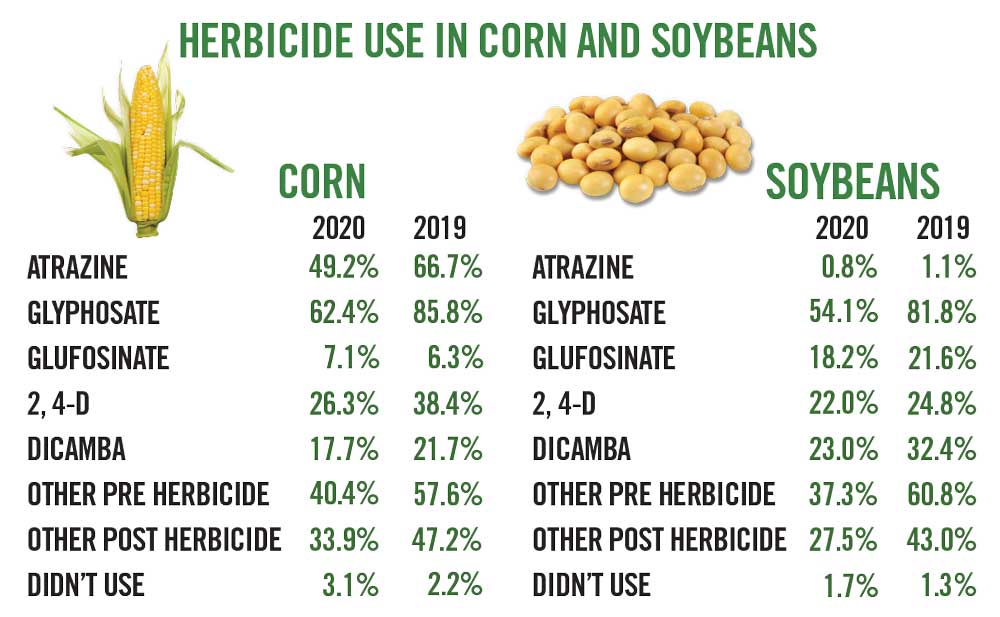
Many no-tillers seem to be cutting back on herbicides, as they’ve reported a big reduction in glyphosate use in particular. In 2020, 62% of survey respondents said they applied the embattled chemical on corn and 54% on soybeans, whereas in 2019 those figures were about 86% in corn and 82% in soybeans.
Atrazine saw a big decline as well, with 49% saying they applied it to corn in 2020 as opposed to 67% in 2019.
On the other hand, in 2020 more no-tillers added a seed treatment to both corn and soybeans beyond what came with the seed than did in 2019. In 2020, 22% of corn growers added a fungicide seed treatment, compared to 19.5% in 2019 and up from 16.1% in 2016. Insecticide seed treatment on corn went up to 24.6% in 2020, compared to 22.4% in 2019; and nematicide use climbed to 8.6% in 2020 compared to 3.5% in 2019.
For soybeans, the increase is less pronounced, with a slight increase in insecticide seed treatments (42.6% in 2020 compared to 40.4% in 2019) and a larger jump for nematicides (20.2% in 2020 vs. 16% in 2019).
Fertilizer Practices
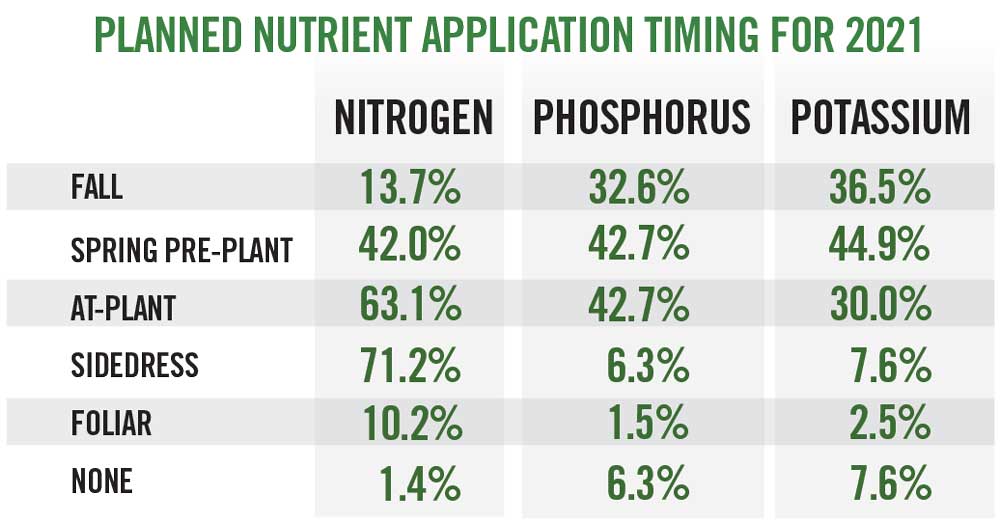
While there had been a large shift toward applying fertilizer at planting time in 2020, in 2021, more no-tillers say they are adjusting back a bit. Growers saying they’ll do a fall application of nitrogen (N) for the 2021 corn crop increased to 13.7%, up from 10.6% in 2020. Planned spring pre-plant applications are up to 42% from 38.7%, while 63.1% intend to fertilize at the time of planting (compared to 66.8%), 71% planning a sidedress application (up from 69.3%), and 10.2% planning to do a foliar application in 2021 vs. 11.1% in 2020. Similar trends can be seen in plans for phosphorus (P) and potassium (K) applications to corn.
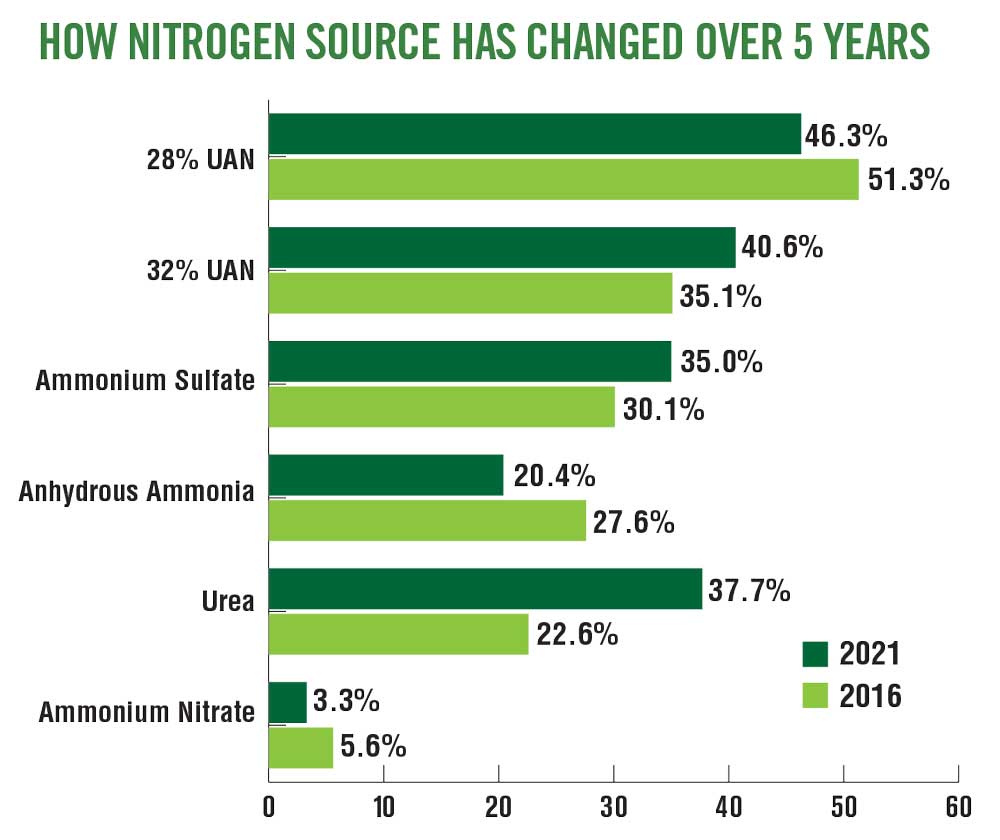
The sources of N are largely continuing a multi-year trend that reveals 28% UAN to still be the most commonly used form (46.3%), though 32% UAN is increasing, as are ammonium sulfate and urea.
Anhydrous ammonia use continues to slide, with only 20.4% of growers planning to apply it in 2021.
About 47% of no-tillers aim to apply N at a rate of 0.8-0.99 pounds per bushel of corn, which is down slightly from 2020’s 50.8%. The next most popular rate is 1.0-1.2 pounds per bushel (30.5%), followed by less than 0.8 pounds per bushel (20.6%) and more than 1.2 pounds per bushel (3.1%).
Certain secondary and micronutrients are gaining traction for corn application in 2021, namely sulfur (95.6%, up from 72.4% in 2016), zinc (73.6%, up from 61.2% in 2016) and boron (48.5%, up from 34.2% in 2016).
After fewer no-tillers applying N, P and K on soybeans in 2020, more no-tillers say they’ll do so in 2021, with 18.2% saying they’ll apply N vs. 16.8% in 2020, both of which are far below a high of 29.7% in 2016.
Applications of P are planned by 57.9% for 2021 (compared to 56% for 2020) and applications of K are planned by 71.6% for 2021 as opposed to 66.2% in 2020. Overall, micronutrient applications in soybeans have fallen to 34.3% for 2021 from 42.7% in 2016, though magnesium is up to 15.8% for 2021 compared to 9.4% in 2016.
In 2020, 55.6% of respondents said they applied manure compared to 52% in 2019. This figure has been steadily climbing since 2016 when 43.9% of no-tillers said they used manure. Cattle manure is the most commonly used type (62.6% in 2020, compared to 55.2% in 2019), followed by poultry manure (29.1% in 2020 vs. 24.1% in 2019) and hog manure (22.9% in 2020 vs. 12.8% in 2019).
There’s a slight shift toward more frequent soil testing. About half the survey respondents (49.4%) said they do soil testing every 3 or more years, but that figure is down from 54.4% in 2019. Not surprisingly, there was a corresponding bump in those who said they are testing annually (19.3% in 2020 compared to 15.4% in 2019.










Post a comment
Report Abusive Comment