By Jim Camberato, Extension Soil Fertility Specialist; R.L. (Bob) Nielsen, Extension Corn Specialist
This is a follow-up article to "Soil Sampling to Assess Current Soil Nitrogen Availability."
We suggest that the 25 ppm NO3-N critical level for manure- or legume-N fertilized soils may be too low for soils that have only received fertilizer N and where N loss conditions have been severe. Where enough rainfall has occurred to cause substantial N loss, we suggest this level of rain has depleted the lower soil profile as well as the upper foot of soil.
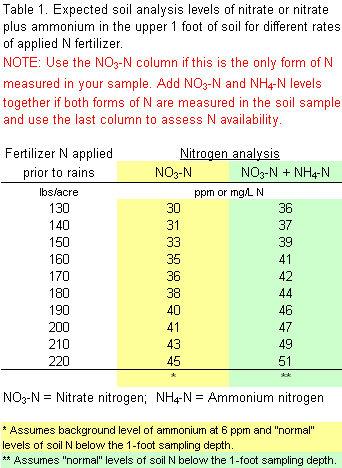 The table includes estimates of expected soil NO3-N levels with different fertilizer rates assuming “normal” background levels of nitrate and ammonium at the time of fertilization and a “normal” amount of movement below the one foot sampling depth (approximately one-third of the fertilizer N is moved below the 1-foot sampling depth but retained within the root zone with normal rainfall).
If the corn is healthy and the growing season is expected to be typical from here on out, we would suggest applying no more than 10 pounds of N for every 2 ppm reduction in soil sample N below the expected levels listed in the table.
Recognize that as a healthy crop moves through the rapid growth phase prior to pollination, soil N levels will naturally decrease in response to rapid N uptake by the plants. However, by the time a healthy crop reaches the V9 leaf stage (about 30 inches tall), only 19 pounds per acre N (equivalent to 5 ppm soil NO3-N in a 1-foot deep sample) have typically been taken up by the plants. But by the time a healthy crop reaches shoulder-high (~V15 or 60 inches tall), approximately 116 pounds per acre N (equivalent to 29 ppm soil NO3-N in a 1-foot deep sample) have been taken up by the plants. With later corn the amount of N in the plant should be considered when evaluating soil N.
The following examples give you an idea of how the tabular information may be used to make this decision.
Example calculation when only NO3-N is determined: Fertilizer N was applied at 160 pounds of N per acre in April as 28% UAN. Only soil NO3-N analysis was requested because it was assumed that most of the urea- and ammonium-N had been converted to nitrate since temperatures were warm prior to the excessive rainfall. The expected NO3-N level from the table above for a 160-pound N application is 35 ppm.
Laboratory results indicated only 20 ppm NO3-N. The suggested N application rate would be:
((35 ppm – 20 ppm) / 2) x 10 = (15 ppm / 2) x 10 = 7.5 x 10 = 75 pounds per acre
Example calculation when both NO3-N and NH4-N are determined: Anhydrous ammonia was applied at 160 pounds of N per acre in March. Since the N application was relatively recent, both NO3-N and NH4-N analyses were requested. The expected NO3-N plus NH4-N levels listed in the table for a 160-pound N application is 41 ppm.
Laboratory results indicated 15 ppm NO3-N and 20 ppm NH4-N for a total measured N level of 35 ppm. The suggested N application rate would be:
((41 ppm – 35 ppm) / 2) x 10 = (6 ppm / 2) x 10 = 3 x 10 = 30 pounds per acre
Evaluating Your Decision
Loss of N due to excessive rainfall and response of corn stressed by excess water and N deficiency is difficult to predict. Unfortunately we frequently find ourselves in this same situation asking how much N is needed and what will be the yield increase. Although we have conducted some planned experiments that apply N to N-stressed corn, it is difficult to plan experiments to evaluate N application to N-stressed corn caused by excess rainfall. But now we have another opportunity.
If you decide to apply additional N to corn, consider leaving three applicator-width strips without additional N through the length of the field to evaluate the response to the additional N. The strips should be distributed randomly across the field, not positioned side-by-side. Compare the yield of these unfertilized strips to adjacent fertilized strips to determine the change in yield and profit due to fertilization.
Collecting this data will help in making future decisions related to N loss and potential profit from supplemental N fertilization. For assistance in planning an evaluation of supplemental N consult the Purdue On-Farm Nitrogen Rate Trial Protocol.
Sidedress N Application Rates
If no fertilizer N has been applied this season or soil N measurements suggest little N remains from fall- and spring-applied N, consider using our current N rate guidelines based on results of field trials conducted since 2006 throughout the state and based on the use of efficient methods and timings of N fertilizer application. This information is summarized at http://www.kingcorn.org/news/timeless/NitrogenMgmt.pdf.
The average Agronomic Optimum N Rate (AONR) for corn/soybeans in 53 trials conducted on medium- and fine-textured soils in southwest, south-central, southeast and west-central Indiana was 208 pounds N per acre.
The average AONR for 30 trials conducted on medium- and fine-textured soils in northwest and north-central Indiana was 212 pounds N per acre. The average AONR for trials conducted on medium- and fine-textured soils in other regions of the state were 232, 251 and 263 pounds N per acre for central (23 trials), east-central (26 trials), and northeast (11 trials) Indiana, respectively.
The average AONR for 16 trials on non-irrigated sandy soils was 202 pounds N per acre. At five Purdue Ag. Centers where we conducted paired trials of corn following soybean (corn/soy) and corn following corn (corn/corn) from 2007-10, the average AONR for corn/corn was 44 pounds greater than for corn/soy while average corn/corn yields were 18 bushels per acre less than the corn/soy yields. Economic optimum N rates for various combinations of N cost and grain price can be obtained from the article referenced above or the Corn Nitrogen Rate Calculator.


Post a comment
Report Abusive Comment